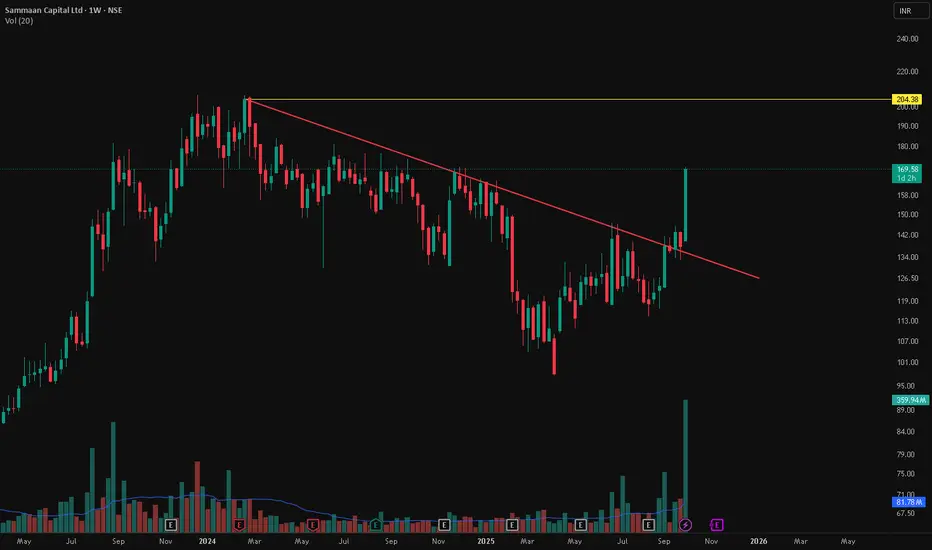
📊 Sammaan Capital Ltd – Major Trendline Breakout with Volume Spike 🚀
📅 Chart Date: October 2, 2025 | Timeframe: Weekly
📍 CMP: ₹169.58 (+23.04%)
📈 Symbol: NSE:SAMMAANCAP
🔍 Technical Analysis
📉 Multi-Month Downtrend Broken
Stock has been consolidating under a falling trendline since late 2023.
This week, price gave a clean breakout above the trendline with a strong bullish candle.
💥 Volume Confirmation
Current Weekly Volume: 359.94M vs Avg 81.78M 🔥
Indicates strong institutional participation.
🟡 Key Resistance
Next major hurdle is ₹204.38 (previous swing high).
Sustained closing above this zone can open doors for higher levels.
📌 Key Levels
Immediate Support (Breakout Retest): ₹142–₹150
Resistance Zone: ₹204.38
Potential Next Targets: ₹220 / ₹250
Stop loss for Swing Trades: ₹135
Disclaimer
The information and publications are not meant to be, and do not constitute, financial, investment, trading, or other types of advice or recommendations supplied or endorsed by TradingView. Read more in the Terms of Use.
Disclaimer
The information and publications are not meant to be, and do not constitute, financial, investment, trading, or other types of advice or recommendations supplied or endorsed by TradingView. Read more in the Terms of Use.