By Ion Jauregui – Analyst at ActivTrades
The global energy sector is experiencing a complex stage of transformation. Major oil companies face the challenge of maintaining profitability in an environment where regulatory pressure, the energy transition, and crude oil price volatility define the corporate agenda.
While companies such as ExxonMobil, Chevron, BP, and TotalEnergies try to balance their investments between renewable energies and fossil fuels, Shell has opted for a different approach, reaffirming its commitment to traditional sources and standing out for its capacity for resilience in an increasingly competitive market.
Fundamental Explanation of the Major Oil Companies
In recent years, the main oil companies have adopted divergent strategies in the face of the energy transition.
ExxonMobil and Chevron, from the United States, maintain a structure focused on hydrocarbon exploration and production, benefitting from a less strict regulatory environment and lower operating costs.
BP and TotalEnergies, on the other hand, are moving forward with diversification into solar, wind, and biofuel energy, although with financial returns that are still modest.
In Europe, environmental regulations and decarbonization goals have forced oil companies to reassess their investment portfolios, prioritizing projects with quick returns and low risk.
In this context, the profit margins of major oil companies are under pressure due to a crude oil barrel price near four-year lows, which forces more efficient capital management and a strategic restructuring of assets.
Fundamental Analysis of Shell
Under the leadership of Wael Sawan, Shell plc has opted for a countercurrent strategy: strengthening its presence in liquefied natural gas (LNG) and other traditional exploration and production activities, while reducing its exposure to low-profitability renewable projects.
During the first nine months of 2025, the consolidated free cash flow fell from $31 billion to $22 billion, reflecting the impact of falling crude prices, despite maintaining a constant production of 2.7 million barrels of oil equivalent per day.
Net debt increased from $35 billion to $41 billion, partly due to the payment of $6 billion in dividends and $10 billion in share buybacks.
By divisions:
Exploration and production: $8.6 billion in cash flow.
Gas segment: $6.6 billion.
Energy trading: $5.2 billion.
Chemical business: $1.6 billion.
Renewable energies: loss of $500 million.
Shell has also announced the abandonment of its biofuels project in Rotterdam and continues to reduce its chemical business, seeking to concentrate on higher-profit activities.
Currently, the stock trades at below 10 times its cash earnings, an attractive multiple compared to TotalEnergies, and with a significant discount relative to U.S. companies.
Technical Analysis of Shell
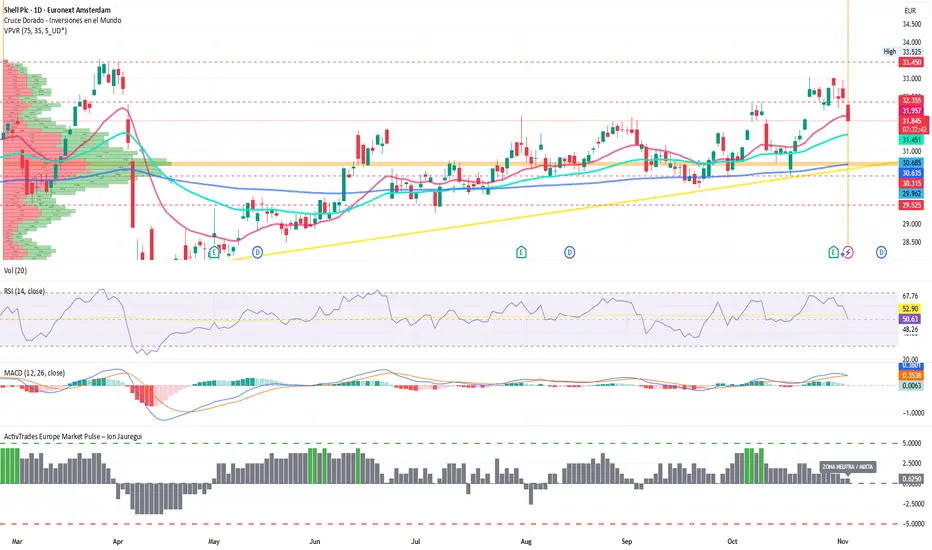
On the technical side, Shell (Ticker AT:SHELL.NE / SHELL.UK) shows a structure where it has attempted to break through the highs reached in the first half of 2025. The price remains this morning above €33.35, just above the 50-day moving average.
The current point of control (POC) is located around €30.75, which has been the most traded area since January of this year. If the current support does not hold, we could see a decline towards the point of control area, which practically coincides with the last impulse zone.
The RSI indicator currently shows a corrective movement toward the neutral zone, while the MACD is in a bullish trend with a histogram lacking volume, which could indicate some trend exhaustion and a movement toward lateralization due to a balance between buyers and sellers.
On the other hand, the ActivTrades Europe Market Pulse indicator shows neutrality and balance in risk, suggesting that this week could mark a clear lateral movement in the price.
Nevertheless, the series of higher highs and higher lows in the weekly chart supports a constructive long-term outlook, as long as the strength of cash flow and return on capital is maintained.
Conclusion
Shell’s strategy, based on pragmatism and real profitability, contrasts with the dominant green narrative. In a fragmented energy market, the company manages to stand out for its ability to generate value even during bearish cycles, maintaining shareholder confidence and consolidating its position as one of the strongest oil companies in the world.
*******************************************************************************************
The information provided does not constitute investment research. The material has not been prepared in accordance with the legal requirements designed to promote the independence of investment research and such should be considered a marketing communication.
All information has been prepared by ActivTrades ("AT"). The information does not contain a record of AT's prices, or an offer of or solicitation for a transaction in any financial instrument. No representation or warranty is given as to the accuracy or completeness of this information.
Any material provided does not have regard to the specific investment objective and financial situation of any person who may receive it. Past performance and forecasting are not a synonym of a reliable indicator of future performance. AT provides an execution-only service. Consequently, any person acting on the information provided does so at their own risk. Political risk is unpredictable. Central bank actions can vary. Platform tools do not guarantee success.
The global energy sector is experiencing a complex stage of transformation. Major oil companies face the challenge of maintaining profitability in an environment where regulatory pressure, the energy transition, and crude oil price volatility define the corporate agenda.
While companies such as ExxonMobil, Chevron, BP, and TotalEnergies try to balance their investments between renewable energies and fossil fuels, Shell has opted for a different approach, reaffirming its commitment to traditional sources and standing out for its capacity for resilience in an increasingly competitive market.
Fundamental Explanation of the Major Oil Companies
In recent years, the main oil companies have adopted divergent strategies in the face of the energy transition.
ExxonMobil and Chevron, from the United States, maintain a structure focused on hydrocarbon exploration and production, benefitting from a less strict regulatory environment and lower operating costs.
BP and TotalEnergies, on the other hand, are moving forward with diversification into solar, wind, and biofuel energy, although with financial returns that are still modest.
In Europe, environmental regulations and decarbonization goals have forced oil companies to reassess their investment portfolios, prioritizing projects with quick returns and low risk.
In this context, the profit margins of major oil companies are under pressure due to a crude oil barrel price near four-year lows, which forces more efficient capital management and a strategic restructuring of assets.
Fundamental Analysis of Shell
Under the leadership of Wael Sawan, Shell plc has opted for a countercurrent strategy: strengthening its presence in liquefied natural gas (LNG) and other traditional exploration and production activities, while reducing its exposure to low-profitability renewable projects.
During the first nine months of 2025, the consolidated free cash flow fell from $31 billion to $22 billion, reflecting the impact of falling crude prices, despite maintaining a constant production of 2.7 million barrels of oil equivalent per day.
Net debt increased from $35 billion to $41 billion, partly due to the payment of $6 billion in dividends and $10 billion in share buybacks.
By divisions:
Exploration and production: $8.6 billion in cash flow.
Gas segment: $6.6 billion.
Energy trading: $5.2 billion.
Chemical business: $1.6 billion.
Renewable energies: loss of $500 million.
Shell has also announced the abandonment of its biofuels project in Rotterdam and continues to reduce its chemical business, seeking to concentrate on higher-profit activities.
Currently, the stock trades at below 10 times its cash earnings, an attractive multiple compared to TotalEnergies, and with a significant discount relative to U.S. companies.
Technical Analysis of Shell
On the technical side, Shell (Ticker AT:SHELL.NE / SHELL.UK) shows a structure where it has attempted to break through the highs reached in the first half of 2025. The price remains this morning above €33.35, just above the 50-day moving average.
The current point of control (POC) is located around €30.75, which has been the most traded area since January of this year. If the current support does not hold, we could see a decline towards the point of control area, which practically coincides with the last impulse zone.
The RSI indicator currently shows a corrective movement toward the neutral zone, while the MACD is in a bullish trend with a histogram lacking volume, which could indicate some trend exhaustion and a movement toward lateralization due to a balance between buyers and sellers.
On the other hand, the ActivTrades Europe Market Pulse indicator shows neutrality and balance in risk, suggesting that this week could mark a clear lateral movement in the price.
Nevertheless, the series of higher highs and higher lows in the weekly chart supports a constructive long-term outlook, as long as the strength of cash flow and return on capital is maintained.
Conclusion
Shell’s strategy, based on pragmatism and real profitability, contrasts with the dominant green narrative. In a fragmented energy market, the company manages to stand out for its ability to generate value even during bearish cycles, maintaining shareholder confidence and consolidating its position as one of the strongest oil companies in the world.
*******************************************************************************************
The information provided does not constitute investment research. The material has not been prepared in accordance with the legal requirements designed to promote the independence of investment research and such should be considered a marketing communication.
All information has been prepared by ActivTrades ("AT"). The information does not contain a record of AT's prices, or an offer of or solicitation for a transaction in any financial instrument. No representation or warranty is given as to the accuracy or completeness of this information.
Any material provided does not have regard to the specific investment objective and financial situation of any person who may receive it. Past performance and forecasting are not a synonym of a reliable indicator of future performance. AT provides an execution-only service. Consequently, any person acting on the information provided does so at their own risk. Political risk is unpredictable. Central bank actions can vary. Platform tools do not guarantee success.
Disclaimer
The information and publications are not meant to be, and do not constitute, financial, investment, trading, or other types of advice or recommendations supplied or endorsed by TradingView. Read more in the Terms of Use.
Disclaimer
The information and publications are not meant to be, and do not constitute, financial, investment, trading, or other types of advice or recommendations supplied or endorsed by TradingView. Read more in the Terms of Use.