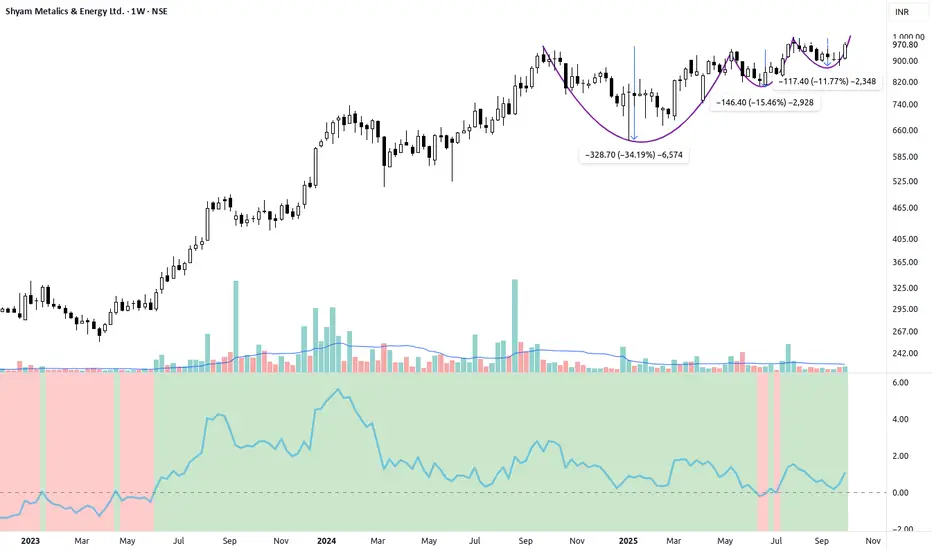
1. The Setup: Textbook Volatility Contraction Pattern (VCP)
SHYAMMETL is setting up for a major breakout after consolidating near its all-time highs. The chart shows a classic Volatility Contraction Pattern (VCP), a powerful sign of institutional accumulation and supply exhaustion.
We can clearly observe three stages of contracting volatility:
This progressively tighter base confirms that selling pressure has dried up and the stock is ready for its next major leg up.
2. Key Technical Confirmation
Superior Relative Strength (RS): The Relative Strength line (bottom indicator) is trending strongly higher and is well above the zero line, confirming that this stock is significantly outperforming the broader market (Nifty). Leaders lead out of bases.
Uptrend Intact: The price is trading well above all key moving averages, which are stacked in a bullish configuration (shorter MAs above longer MAs). The long-term trend remains extremely robust.
Volume: Volume has been quiet during the base formation, which is ideal. We expect a large surge of breakout volume to confirm the move.
3. The Trade Plan
Entry Signal: Look for a decisive daily or weekly close above the ₹1,000 psychological and technical resistance level, backed by a significant surge in trading volume.
Stop Loss (Risk Management): Place a tight, objective stop loss just below the low of the final tight contraction range (e.g., around ₹830-840). This defines your maximum risk per share.
Target Expectation: Based on the strength of the VCP and superior relative strength, the expectation is for a sustained move into new All-Time Highs and a large multi-quarter trend extension.
#Disclaimer: This is for educational and observation purposes only and is not financial advice. Trade at your own risk.
SHYAMMETL is setting up for a major breakout after consolidating near its all-time highs. The chart shows a classic Volatility Contraction Pattern (VCP), a powerful sign of institutional accumulation and supply exhaustion.
We can clearly observe three stages of contracting volatility:
- Contraction 1: Deepest pullback (~34%)
- Contraction 2: Shallower pullback (~15%)
- Contraction 3: Tightest pullback (~11%)
This progressively tighter base confirms that selling pressure has dried up and the stock is ready for its next major leg up.
2. Key Technical Confirmation
Superior Relative Strength (RS): The Relative Strength line (bottom indicator) is trending strongly higher and is well above the zero line, confirming that this stock is significantly outperforming the broader market (Nifty). Leaders lead out of bases.
Uptrend Intact: The price is trading well above all key moving averages, which are stacked in a bullish configuration (shorter MAs above longer MAs). The long-term trend remains extremely robust.
Volume: Volume has been quiet during the base formation, which is ideal. We expect a large surge of breakout volume to confirm the move.
3. The Trade Plan
Entry Signal: Look for a decisive daily or weekly close above the ₹1,000 psychological and technical resistance level, backed by a significant surge in trading volume.
Stop Loss (Risk Management): Place a tight, objective stop loss just below the low of the final tight contraction range (e.g., around ₹830-840). This defines your maximum risk per share.
Target Expectation: Based on the strength of the VCP and superior relative strength, the expectation is for a sustained move into new All-Time Highs and a large multi-quarter trend extension.
#Disclaimer: This is for educational and observation purposes only and is not financial advice. Trade at your own risk.
Disclaimer
The information and publications are not meant to be, and do not constitute, financial, investment, trading, or other types of advice or recommendations supplied or endorsed by TradingView. Read more in the Terms of Use.
Disclaimer
The information and publications are not meant to be, and do not constitute, financial, investment, trading, or other types of advice or recommendations supplied or endorsed by TradingView. Read more in the Terms of Use.