

Next report date
—
Report period
—
EPS estimate
—
Revenue estimate
—
43.50INR
8.58 BINR
125.95 BINR
62.11 M
About SHYAM METALICS AND ENGY L
Sector
Industry
Headquarters
Kolkata
Website
Employees (FY)
14.64 K
Founded
2002
ISIN
INE810G01011
FIGI
BBG00MRZ1D68
Shyam Metalics & Energy Ltd. engages in the manufacture and sale of ferro alloys, iron and steel products and power generation. The company was founded on December 10, 2002 and is headquartered in Kolkata, India.

SHYAMMAT📢breakout stock📢
🫸 Wait for the Retest 🫷
These are swing ideas which you can add your watchlist and analysis for yourself !
Keep on your radar!
This content only education purpose!
❗I am not sebi ragister❗
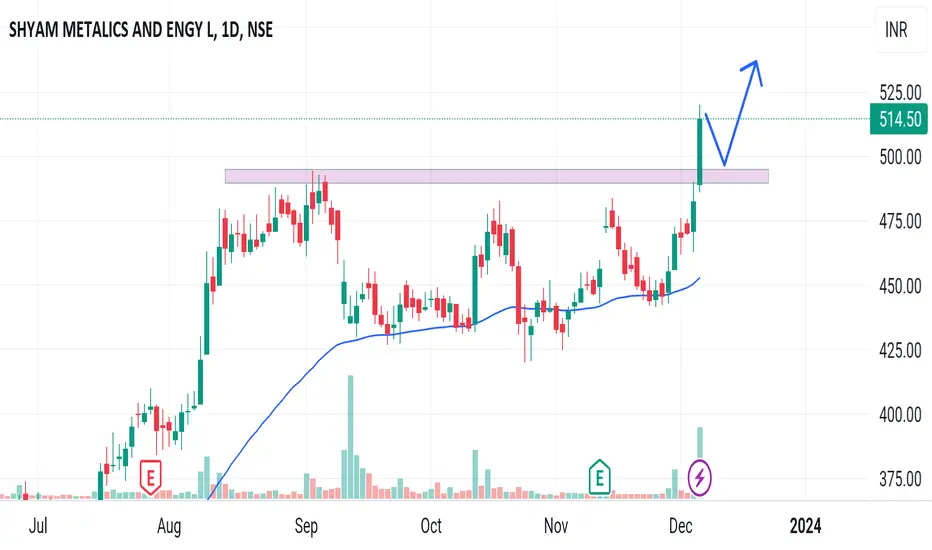
SHYAMMETLStock has given a range breakout with good volumes. Wait for a pullback for entry
Note- Trade as per your analysis

Metal is ready for boomBreakout trading implementation:
1. **Identifying New Trends:** Breakout trading helps traders identify the beginning of new trends by focusing on price levels where an asset breaks out of its historical trading range.
2. **Volatility Indicator:** Breakouts often occur when there's increased volat

#Shyam Metalicstrading above life time high
weekly inside candles showing a pause. above this will blast
look volume spread
Roaring Lion
enter above previous week high and Keep The Sl below this week

Shyam Mettalics-Nice BreakoutShyam Mettalics-Nice Breakout
Capital to be deployed- 20k
Investing Price -375-377
Breakout Price -375
Stoploss -344
Targets - 442-527
#shyammettalics #StockMarketindia #StockToWatch #StocksInFocus #stockstowatch #StocksToTrade

Shyam MetallicsAgain from Metal sector, Looks good above 340 levels as marked in the chart.
Indicators show strength in all the time frames

A SHARE RELATED TECHNO AND FUNDA ANALYSISLooking of the recent price action and chart analysis this share looks like we making good profit
we will get around 50% profit
I'M buying shares worth Rs.100000 one can buy it with stop loss of 280 on daily basis
This company expand itself rapidly this also become multibagger
Currently i'm taki

#ShyamMetalicsShyam Metalics cmp 300
Buy above 317
SL 280 clbs
target 330/350/380
Swing trading
Fundamentally good company
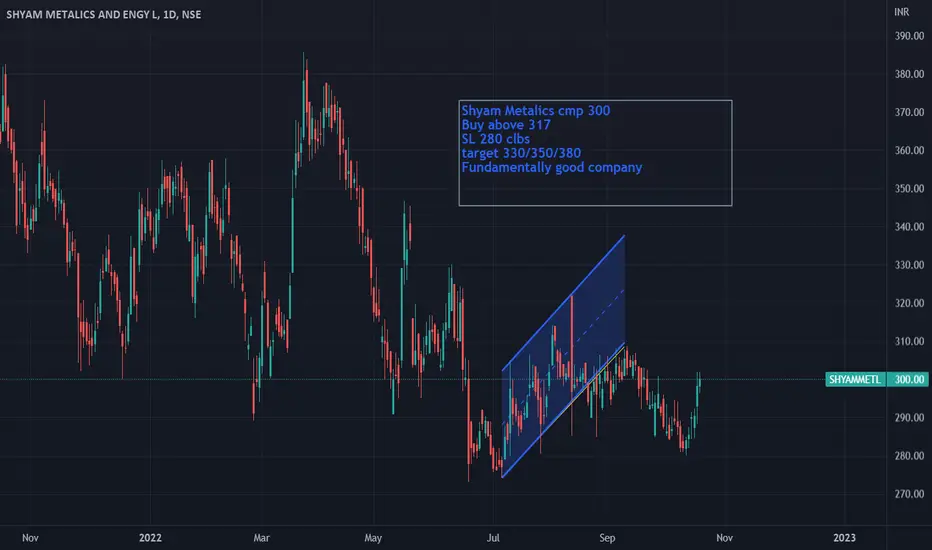
Breakout expectation in SHYAM METALBreakout expectation in SHYAM METAL
Supposed to break resistance above 329
330 if sustain then expecting upside movement towards 340/350

See all ideas
Trade directly on the supercharts through our supported, fully-verified and user-reviewed brokers.


Frequently Asked Questions
The current price of SHYAMMETL is 580.05 INR — it has decreased by 0.66% in the past 24 hours. Watch SHYAM METALICS AND ENGY L stock price performance more closely on the chart.
Depending on the exchange, the stock ticker may vary. For instance, on NSE exchange SHYAM METALICS AND ENGY L stocks are traded under the ticker SHYAMMETL.
SHYAM METALICS AND ENGY L is going to release the next earnings report on May 29, 2024. Keep track of upcoming events with our Earnings Calendar.
SHYAMMETL stock is 4.04% volatile and has beta coefficient of 1.23. Track SHYAM METALICS AND ENGY L stock price on the chart and check out the list of the most volatile stocks — is SHYAM METALICS AND ENGY L there?
SHYAM METALICS AND ENGY L revenue for the last quarter amounts to 33.15 B INR despite the estimated figure of 32.65 B INR. In the next quarter revenue is expected to reach 35.86 B INR.
Yes, you can track SHYAM METALICS AND ENGY L financials in yearly and quarterly reports right on TradingView.
SHYAMMETL stock has fallen by 5.53% compared to the previous week, the month change is a 7.93% fall, over the last year SHYAM METALICS AND ENGY L has showed a 90.90% increase.
SHYAMMETL net income for the last quarter is 1.27 B INR, while the quarter before that showed 4.84 B INR of net income which accounts for −73.70% change. Track more SHYAM METALICS AND ENGY L financial stats to get the full picture.
Today SHYAM METALICS AND ENGY L has the market capitalization of 162.92 B, it has decreased by 3.79% over the last week.
SHYAM METALICS AND ENGY L dividend yield was 1.37% in 2022, and payout ratio reached 10.71%. The year before the numbers were 1.99% and 10.45% correspondingly. See high-dividend stocks and find more opportunities for your portfolio.
Like other stocks, SHYAMMETL shares are traded on stock exchanges, e.g. Nasdaq, Nyse, Euronext, and the easiest way to buy them is through an online stock broker. To do this, you need to open an account and follow a broker's procedures, then start trading. You can trade SHYAM METALICS AND ENGY L stock right from TradingView charts — choose your broker and connect to your account.
SHYAMMETL reached its all-time high on Jan 31, 2024 with the price of 737.80 INR, and its all-time low was 254.55 INR and was reached on Mar 29, 2023. View more price dynamics on SHYAMMETL chart.
See other stocks reaching their highest and lowest prices.
See other stocks reaching their highest and lowest prices.
As of May 13, 2024, the company has 14.64 K employees. See our rating of the largest employees — is SHYAM METALICS AND ENGY L on this list?
Investing in stocks requires a comprehensive research: you should carefully study all the available data, e.g. company's financials, related news, and its technical analysis. So SHYAM METALICS AND ENGY L technincal analysis shows the sell today, and its 1 week rating is neutral. Since market conditions are prone to changes, it's worth looking a bit further into the future — according to the 1 month rating SHYAM METALICS AND ENGY L stock shows the buy signal. See more of SHYAM METALICS AND ENGY L technicals for a more comprehensive analysis.
If you're still not sure, try looking for inspiration in our curated watchlists.
If you're still not sure, try looking for inspiration in our curated watchlists.
We've gathered analysts' opinions on SHYAM METALICS AND ENGY L future price: according to them, SHYAMMETL price has a max estimate of 815.00 INR and a min estimate of 580.00 INR. Watch SHYAMMETL chart and read a more detailed SHYAM METALICS AND ENGY L stock forecast: see what analysts think of SHYAM METALICS AND ENGY L and suggest that you do with its stocks.
EBITDA measures a company's operating performance, its growth signifies an improvement in the efficiency of a company. SHYAM METALICS AND ENGY L EBITDA is 15.34 B INR, and current EBITDA margin is 12.48%. See more stats in SHYAM METALICS AND ENGY L financial statements.