SLDB Fib. & Chart Update:
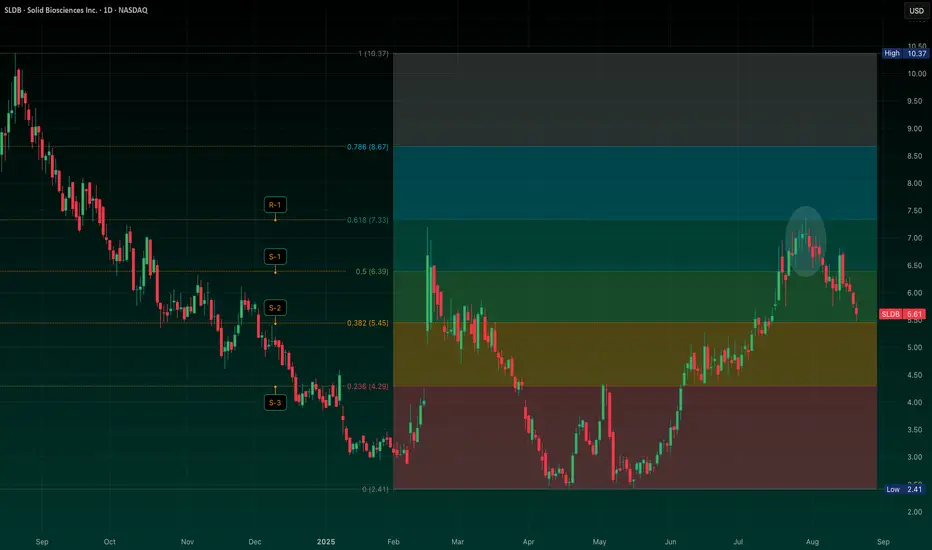
As flagged in my earlier post (Aug 4), weakness was expected absent fresh catalysts. The chart is now sitting around the 0.382 Fib retrace (~$5.45) -- a key support zone, IMO.
If this level doesn’t hold, the next downside marker lines up near the 0.236 (~$4.29). On the flip side, stabilization here would keep the prior breakout structure intact.
Nothing’s changed on the fundamental side since ER, so price action is doing the heavy lifting. And with the broader market showing signs of rolling over, sellers may press harder if this level cracks.
This is the spot where the tape either finds footing or breaks lower into the next leg. Stay tuned and GLTA.
Disclaimer
The information and publications are not meant to be, and do not constitute, financial, investment, trading, or other types of advice or recommendations supplied or endorsed by TradingView. Read more in the Terms of Use.
Disclaimer
The information and publications are not meant to be, and do not constitute, financial, investment, trading, or other types of advice or recommendations supplied or endorsed by TradingView. Read more in the Terms of Use.