SNDK - CURRENT PRICE : 228.47
🔥Bullish Scenario Supported by Trend Structure & Fibonacci Reactions
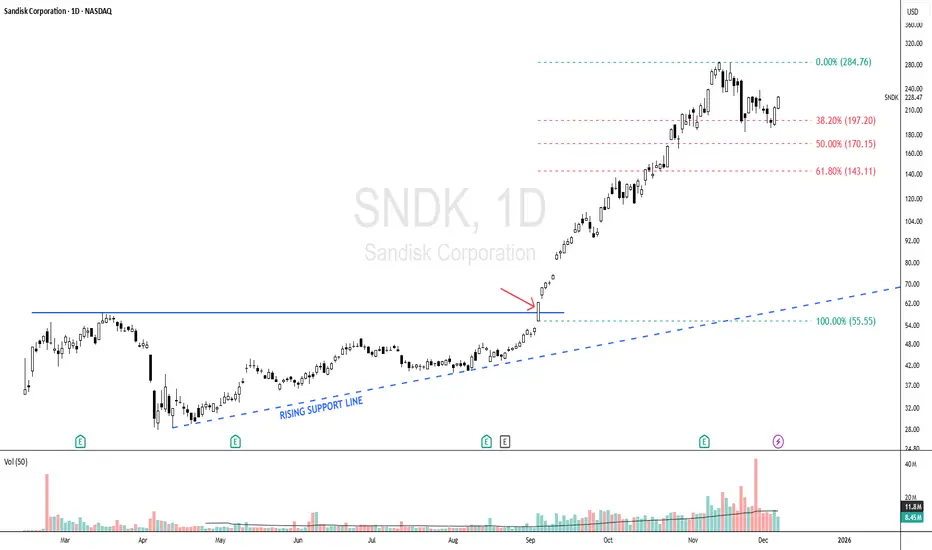
SNDK began showing early signs of a bullish scenario when price respected a rising support line, indicating steady accumulation and higher lows forming. The major bullish confirmation occurred on 04 September, when price broke above the 55.55 level (look at red arrow), triggering strong momentum and leading to a rapid vertical rally. As with many fast-moving stocks, a healthy retracement followed, and SNDK pulled back precisely toward the Fibonacci 38.2% golden ratio, where the stock found support and began forming a new base. This behavior suggests the prior uptrend remains intact, and the uptrend may resume as long as the stock continues to hold above this retracement zone.
Some Elliott Wave practitioners may also interpret the current structure as a developing Wave 5, suggesting the potential for another upside leg if the trend continues to follow impulsive wave behavior.
Take note that I'm using logarithmic scale chart because the share price has already risen more than 300% since the 04 September breakout, making it more suitable for analyzing large percentage moves and trend structure.
ENTRY PRICE : 228.47
FIRST TARGET : 270.00
SECOND TARGET : 324.00 (Projected based on Fibonacci extension)
SUPPORT : 183.00 (The low of 21 Nov HAMMER candle)
🔥Bullish Scenario Supported by Trend Structure & Fibonacci Reactions
SNDK began showing early signs of a bullish scenario when price respected a rising support line, indicating steady accumulation and higher lows forming. The major bullish confirmation occurred on 04 September, when price broke above the 55.55 level (look at red arrow), triggering strong momentum and leading to a rapid vertical rally. As with many fast-moving stocks, a healthy retracement followed, and SNDK pulled back precisely toward the Fibonacci 38.2% golden ratio, where the stock found support and began forming a new base. This behavior suggests the prior uptrend remains intact, and the uptrend may resume as long as the stock continues to hold above this retracement zone.
Some Elliott Wave practitioners may also interpret the current structure as a developing Wave 5, suggesting the potential for another upside leg if the trend continues to follow impulsive wave behavior.
Take note that I'm using logarithmic scale chart because the share price has already risen more than 300% since the 04 September breakout, making it more suitable for analyzing large percentage moves and trend structure.
ENTRY PRICE : 228.47
FIRST TARGET : 270.00
SECOND TARGET : 324.00 (Projected based on Fibonacci extension)
SUPPORT : 183.00 (The low of 21 Nov HAMMER candle)
Disclaimer
The information and publications are not meant to be, and do not constitute, financial, investment, trading, or other types of advice or recommendations supplied or endorsed by TradingView. Read more in the Terms of Use.
Disclaimer
The information and publications are not meant to be, and do not constitute, financial, investment, trading, or other types of advice or recommendations supplied or endorsed by TradingView. Read more in the Terms of Use.