Synopsys  SNPS has risen some 20% over the past roughly two weeks in part on word that Nvidia
  NVDA has invested $2 billion in the chip-engineering-solutions firm. Let's see what Synopsis' chart and fundamentals show in the deal's wake and ahead of SNPS's earnings report due out next week.
Synopsis' Fundamental Analysis
The news broke Monday that AI chip giant Nvidia had bought $2 billion of SNPS common stock at a $414.79 average price (vs. the $463.74 the shares closed at Thursday).
The two firms also announced a strategic partnership that will integrate Nvidia's strength in computing infrastructure with Synopsys' semiconductor-engineering and circuit-manufacturing capabilities. This partnership isn't exclusive, but both sides have an obvious financial interest in making it work.
Meanwhile, Synopsys plans to report fiscal Q4 results after the closing bell next Wednesday, with the Street looking for $2.88 in adjusted earnings per share on $2.24 billion of revenue.
While a top-line print like that would be good for almost 37% in year-over-year growth, the bottom-line number wouldn't really compare all that well with the $3.40 in adjusted EPS that Synopsys reported for the same period last year.
In fact, 16 of the 18 sell-side analysts that I know of who cover SNPS have lowered their earnings estimates for the quarter since the period began. (Two analysts have left their earnings estimates unchanged.)
And while SNPS rose on the Nvidia news, the stock is still down nearly 30% from a $651.73 all-time intraday high that it hit on July 30.
Much of that decline came on Sept. 10, when SNPS fell nearly 36% in a single session after reporting poorly received Q3 earnings.
Synopsys' Technical Analysis
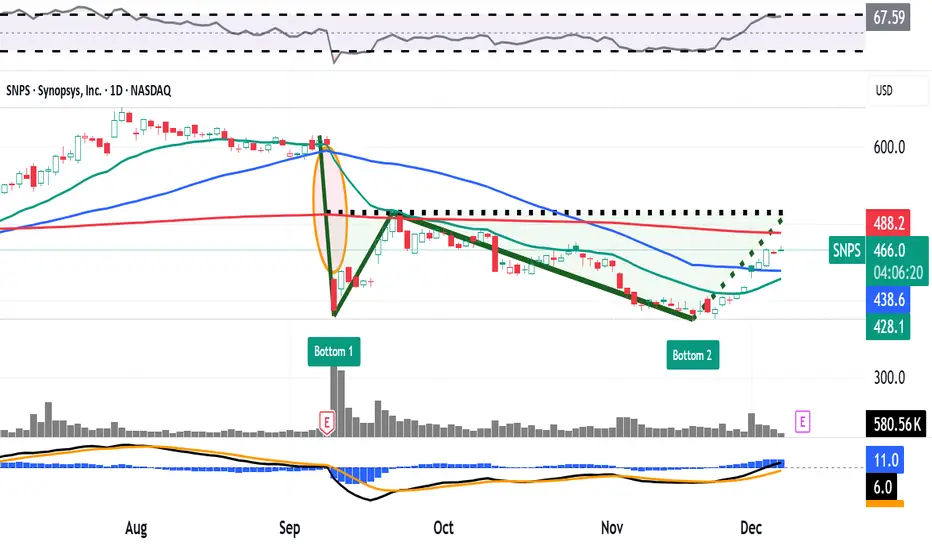
Has Nvidia's purchase helped put in a floor on Synopsys' stock price? Let's look at SNPS's chart going back some five months and running through Monday afternoon:

This chart appears to show a rapidly improving technical picture for the stock, even though readers will see Synopsis' 35.8% one-day drop in early September, marked as "Bottom 1" above.
SNPS partially recovered over the next month, but eventually retested that early September low as the chart's right (marked "Bottom 2" above). This created a double-bottom pattern of bullish reversal, as denoted by the green jagged line and green shaded area.
This pattern indicates a $515 pivot, but SNPS has more-immediate levels to contend with at the moment.
First up would be Synopsys' 50-day Simple Moving Average, or "SMA," denoted by a blue line at $441 in the chart above. After that would be the stock's 200-day SMA (marked with a red line) at $489.
Synopsys recently crossed the 50-day SMA, and holding either of those lines would help create an environment more conducive to increased long-side participation among portfolio managers.
Other factors that bulls might find interesting would be the unfilled gap above, which would need the stock to tick to $602.50 or higher to fill. Stocks don't always fill in unfilled gaps in technical analysis, but they often do.
Looking at other technical measures, Synopsis' Relative Strength Index (or "RSI," marked with a gray line at the chart's top) is currently looking better than neutral.
Similarly, the stock's daily Moving Average Convergence Divergence indicator (or "MACD," denoted by black and gold lines and blue bars at the chart's bottom) is improving, although not yet bullishly postured.
The histogram of Synopsys' 9-day Exponential Moving Average (or "EMA," marked with blue bars) is now above the zero-bound. That's a short-term bullish signal.
Meanwhile, the 12-day EMA (the black line) has crossed above the 26-day EMA (the gold line). That's positive as well, although the one negative would be that both lines are still below zero.
An Options Option
As I write this, options markets are pricing in a roughly 5% move in response to next Wednesday's earnings.
Options traders who are bullish on Synopsys but unwilling to plunk down a ton of bread for the equity might try a simple bull-call spread. In that scenario, you buy one call while selling a second call with a higher strike price, but the same expiration date.
Here's an example using Synopsys' 50-day SMA as the first call's strike price:
-- Long one SNPS $440 call with a Dec. 12 expiration (i.e., after next week's earnings release). This cost about $27.55 at recent prices.
-- Short one SNPS Dec. 12 $460 call for about $17.10.
Net debit: $10.45.
The trader is risking a $10.45 theoretical maximum loss with the above spread to try to earn a maximum potential gain at expiration of $9.55 (the difference between the two strike prices minus the strategy's net debit above).
(Moomoo Technologies Inc. Markets Commentator Stephen "Sarge" Guilfoyle had no position in SNPS at the time of writing this column.)
This article discusses technical analysis, other approaches, including fundamental analysis, may offer very different views. The examples provided are for illustrative purposes only and are not intended to be reflective of the results you can expect to achieve. Specific security charts used are for illustrative purposes only and are not a recommendation, offer to sell, or a solicitation of an offer to buy any security. Past investment performance does not indicate or guarantee future success. Returns will vary, and all investments carry risks, including loss of principal. This content is also not a research report and is not intended to serve as the basis for any investment decision. The information contained in this article does not purport to be a complete description of the securities, markets, or developments referred to in this material. Moomoo and its affiliates make no representation or warranty as to the article's adequacy, completeness, accuracy or timeliness for any particular purpose of the above content. Furthermore, there is no guarantee that any statements, estimates, price targets, opinions or forecasts provided herein will prove to be correct.
Options trading is risky and not appropriate for everyone. Read the Options Disclosure Document (https://j.moomoo.com/017y9J) before trading. Options are complex and you may quickly lose the entire investment. Supporting docs for any claims will be furnished upon request.
Options trading subject to eligibility requirements. Strategies available will depend on options level approved.
Maximum potential loss and profit for options are calculated based on the single leg or an entire multi-leg trade remaining intact until expiration with no option contracts being exercised or assigned. These figures do not account for a portion of a multi-leg strategy being changed or removed or the trader assuming a short or long position in the underlying stock at or before expiration. Therefore, it is possible to lose more than the theoretical max loss of a strategy.
Moomoo is a financial information and trading app offered by Moomoo Technologies Inc. In the U.S., investment products and services on Moomoo are offered by Moomoo Financial Inc., Member FINRA/SIPC.
TradingView is an independent third party not affiliated with Moomoo Financial Inc., Moomoo Technologies Inc., or its affiliates. Moomoo Financial Inc. and its affiliates do not endorse, represent or warrant the completeness and accuracy of the data and information available on the TradingView platform and are not responsible for any services provided by the third-party platform.
Synopsis' Fundamental Analysis
The news broke Monday that AI chip giant Nvidia had bought $2 billion of SNPS common stock at a $414.79 average price (vs. the $463.74 the shares closed at Thursday).
The two firms also announced a strategic partnership that will integrate Nvidia's strength in computing infrastructure with Synopsys' semiconductor-engineering and circuit-manufacturing capabilities. This partnership isn't exclusive, but both sides have an obvious financial interest in making it work.
Meanwhile, Synopsys plans to report fiscal Q4 results after the closing bell next Wednesday, with the Street looking for $2.88 in adjusted earnings per share on $2.24 billion of revenue.
While a top-line print like that would be good for almost 37% in year-over-year growth, the bottom-line number wouldn't really compare all that well with the $3.40 in adjusted EPS that Synopsys reported for the same period last year.
In fact, 16 of the 18 sell-side analysts that I know of who cover SNPS have lowered their earnings estimates for the quarter since the period began. (Two analysts have left their earnings estimates unchanged.)
And while SNPS rose on the Nvidia news, the stock is still down nearly 30% from a $651.73 all-time intraday high that it hit on July 30.
Much of that decline came on Sept. 10, when SNPS fell nearly 36% in a single session after reporting poorly received Q3 earnings.
Synopsys' Technical Analysis
Has Nvidia's purchase helped put in a floor on Synopsys' stock price? Let's look at SNPS's chart going back some five months and running through Monday afternoon:
This chart appears to show a rapidly improving technical picture for the stock, even though readers will see Synopsis' 35.8% one-day drop in early September, marked as "Bottom 1" above.
SNPS partially recovered over the next month, but eventually retested that early September low as the chart's right (marked "Bottom 2" above). This created a double-bottom pattern of bullish reversal, as denoted by the green jagged line and green shaded area.
This pattern indicates a $515 pivot, but SNPS has more-immediate levels to contend with at the moment.
First up would be Synopsys' 50-day Simple Moving Average, or "SMA," denoted by a blue line at $441 in the chart above. After that would be the stock's 200-day SMA (marked with a red line) at $489.
Synopsys recently crossed the 50-day SMA, and holding either of those lines would help create an environment more conducive to increased long-side participation among portfolio managers.
Other factors that bulls might find interesting would be the unfilled gap above, which would need the stock to tick to $602.50 or higher to fill. Stocks don't always fill in unfilled gaps in technical analysis, but they often do.
Looking at other technical measures, Synopsis' Relative Strength Index (or "RSI," marked with a gray line at the chart's top) is currently looking better than neutral.
Similarly, the stock's daily Moving Average Convergence Divergence indicator (or "MACD," denoted by black and gold lines and blue bars at the chart's bottom) is improving, although not yet bullishly postured.
The histogram of Synopsys' 9-day Exponential Moving Average (or "EMA," marked with blue bars) is now above the zero-bound. That's a short-term bullish signal.
Meanwhile, the 12-day EMA (the black line) has crossed above the 26-day EMA (the gold line). That's positive as well, although the one negative would be that both lines are still below zero.
An Options Option
As I write this, options markets are pricing in a roughly 5% move in response to next Wednesday's earnings.
Options traders who are bullish on Synopsys but unwilling to plunk down a ton of bread for the equity might try a simple bull-call spread. In that scenario, you buy one call while selling a second call with a higher strike price, but the same expiration date.
Here's an example using Synopsys' 50-day SMA as the first call's strike price:
-- Long one SNPS $440 call with a Dec. 12 expiration (i.e., after next week's earnings release). This cost about $27.55 at recent prices.
-- Short one SNPS Dec. 12 $460 call for about $17.10.
Net debit: $10.45.
The trader is risking a $10.45 theoretical maximum loss with the above spread to try to earn a maximum potential gain at expiration of $9.55 (the difference between the two strike prices minus the strategy's net debit above).
(Moomoo Technologies Inc. Markets Commentator Stephen "Sarge" Guilfoyle had no position in SNPS at the time of writing this column.)
This article discusses technical analysis, other approaches, including fundamental analysis, may offer very different views. The examples provided are for illustrative purposes only and are not intended to be reflective of the results you can expect to achieve. Specific security charts used are for illustrative purposes only and are not a recommendation, offer to sell, or a solicitation of an offer to buy any security. Past investment performance does not indicate or guarantee future success. Returns will vary, and all investments carry risks, including loss of principal. This content is also not a research report and is not intended to serve as the basis for any investment decision. The information contained in this article does not purport to be a complete description of the securities, markets, or developments referred to in this material. Moomoo and its affiliates make no representation or warranty as to the article's adequacy, completeness, accuracy or timeliness for any particular purpose of the above content. Furthermore, there is no guarantee that any statements, estimates, price targets, opinions or forecasts provided herein will prove to be correct.
Options trading is risky and not appropriate for everyone. Read the Options Disclosure Document (https://j.moomoo.com/017y9J) before trading. Options are complex and you may quickly lose the entire investment. Supporting docs for any claims will be furnished upon request.
Options trading subject to eligibility requirements. Strategies available will depend on options level approved.
Maximum potential loss and profit for options are calculated based on the single leg or an entire multi-leg trade remaining intact until expiration with no option contracts being exercised or assigned. These figures do not account for a portion of a multi-leg strategy being changed or removed or the trader assuming a short or long position in the underlying stock at or before expiration. Therefore, it is possible to lose more than the theoretical max loss of a strategy.
Moomoo is a financial information and trading app offered by Moomoo Technologies Inc. In the U.S., investment products and services on Moomoo are offered by Moomoo Financial Inc., Member FINRA/SIPC.
TradingView is an independent third party not affiliated with Moomoo Financial Inc., Moomoo Technologies Inc., or its affiliates. Moomoo Financial Inc. and its affiliates do not endorse, represent or warrant the completeness and accuracy of the data and information available on the TradingView platform and are not responsible for any services provided by the third-party platform.
Disclaimer
The information and publications are not meant to be, and do not constitute, financial, investment, trading, or other types of advice or recommendations supplied or endorsed by TradingView. Read more in the Terms of Use.
Disclaimer
The information and publications are not meant to be, and do not constitute, financial, investment, trading, or other types of advice or recommendations supplied or endorsed by TradingView. Read more in the Terms of Use.