SOL.D
1 month bars
Log Scale
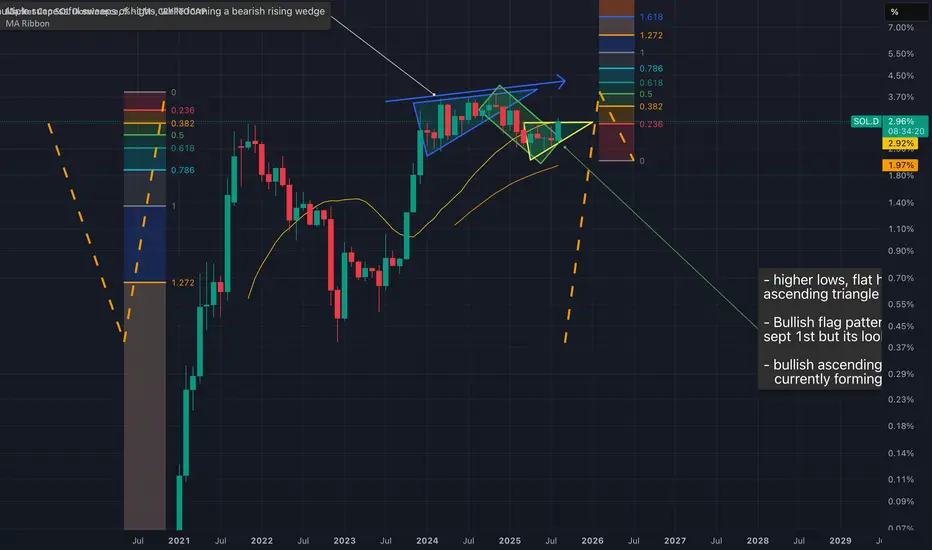
Two major fib retracements
Left - nov '21 -> Dec '22 -> Jan '25
Right - Dec '22 -> Jan '25 -> Apr '25
From the bear cycle low the parabolic rally turned into a bearish rising wedge, bounded by higher highs and lower highs. this pattern ended with a SOL.D 3.97%.
Within this bearish rising wedge, and continuing after its completion a Bullish flag pattern began forming. Why I think this is a bullish flag, besides the shape, and that my theory is that it is a continuation pattern of the previous large move (high - low - high) is that is respecting fib levels from the major retracement on the left. The bullish flag bottom left corner finds support between the 0.61 and 0.78 fib levels from the left major fib retracement and rejects attempts to test for support at 0.78, as this monthly candle closes a bullish ascending triangle begins to form.
Within the bull flag an ascending triangle has formed outlined by flat highs and higher lows .
Both the bull flag and the bullish ascending triangle are continuation patterns and my contention is they will once again respect fib levels from the major fib retracement on the left. that is why I think these are bullish continuation patterns within a multi-year cycle, a cycle that was cut short by the whole ftx cascade.
The bull flag and the ascending triangle share bottoms formed by higher lows, and once these higher lows regain the 0.61 fib from the major fib retracement (left) a breakout occurs from the bull flag. This breakout candle is the aug '25 candle that is about to close.
To confirm this ascending triangle, as much as I would like it to break out to the upside immediately, I think we may need to see a September monthly candle that abides the fib retracements from the major move (left) and should be bound by the 0.38 fib (sept high) and 0.5 fib (sept low). This would be the first candle in the bullish ascending triangle that is fully outside of the previous pattern (the bull flag) and would clarify that ascending triangle as distinct and meaningful.
The fib scale on the right outlines some potential targets for a SOL.D breakout, price discovery and new highs in the coming months.
Hope you enjoyed the analysis, please to like, share and leave a comment.
1 month bars
Log Scale
Two major fib retracements
Left - nov '21 -> Dec '22 -> Jan '25
Right - Dec '22 -> Jan '25 -> Apr '25
From the bear cycle low the parabolic rally turned into a bearish rising wedge, bounded by higher highs and lower highs. this pattern ended with a SOL.D 3.97%.
Within this bearish rising wedge, and continuing after its completion a Bullish flag pattern began forming. Why I think this is a bullish flag, besides the shape, and that my theory is that it is a continuation pattern of the previous large move (high - low - high) is that is respecting fib levels from the major retracement on the left. The bullish flag bottom left corner finds support between the 0.61 and 0.78 fib levels from the left major fib retracement and rejects attempts to test for support at 0.78, as this monthly candle closes a bullish ascending triangle begins to form.
Within the bull flag an ascending triangle has formed outlined by flat highs and higher lows .
Both the bull flag and the bullish ascending triangle are continuation patterns and my contention is they will once again respect fib levels from the major fib retracement on the left. that is why I think these are bullish continuation patterns within a multi-year cycle, a cycle that was cut short by the whole ftx cascade.
The bull flag and the ascending triangle share bottoms formed by higher lows, and once these higher lows regain the 0.61 fib from the major fib retracement (left) a breakout occurs from the bull flag. This breakout candle is the aug '25 candle that is about to close.
To confirm this ascending triangle, as much as I would like it to break out to the upside immediately, I think we may need to see a September monthly candle that abides the fib retracements from the major move (left) and should be bound by the 0.38 fib (sept high) and 0.5 fib (sept low). This would be the first candle in the bullish ascending triangle that is fully outside of the previous pattern (the bull flag) and would clarify that ascending triangle as distinct and meaningful.
The fib scale on the right outlines some potential targets for a SOL.D breakout, price discovery and new highs in the coming months.
Hope you enjoyed the analysis, please to like, share and leave a comment.
Disclaimer
The information and publications are not meant to be, and do not constitute, financial, investment, trading, or other types of advice or recommendations supplied or endorsed by TradingView. Read more in the Terms of Use.
Disclaimer
The information and publications are not meant to be, and do not constitute, financial, investment, trading, or other types of advice or recommendations supplied or endorsed by TradingView. Read more in the Terms of Use.