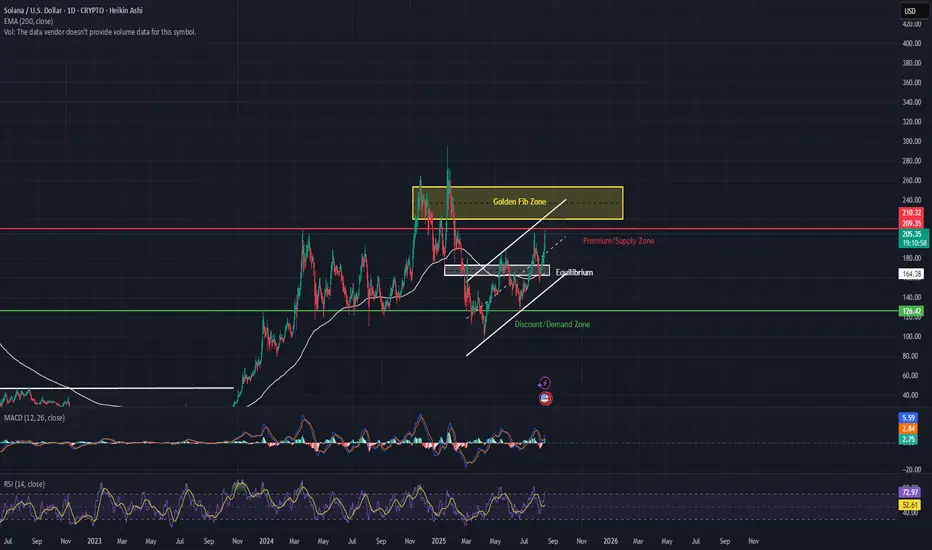
Solana is pressing against the top of its rising channel and is now within striking distance of the Golden Fib Zone ($210–$240). This is a critical area that could decide whether SOL charges toward its All-Time High (ATH) or pauses for a healthy pullback.
A confirmed daily candle break and close above the channel and into the Fib Zone would be a strong bullish signal — but historical behavior suggests that the first touch of the Fib Zone often triggers a rejection before the next leg higher.
📈 Primary Bullish Scenario
SOL breaks above the upper channel trendline and closes inside the Golden Fib Zone.
Price faces initial rejection near the bottom of the Fib Zone (~$210–$215) as short-term traders take profit.
This pullback finds support at the Premium/Supply Zone floor (~$200–$205), which aligns with a key structure level.
After resetting momentum indicators (RSI & MACD), price launches into a second leg toward the ATH (~$260–$270).
✅ Buy Zone on Retest: $200–$205 after rejection from $210–$215.
🎯 Take Profit Targets:
TP1: $240 (upper Fib Zone)
TP2: $260–$270 (ATH retest)
📉 Bearish Scenario
If SOL fails to hold $200 after the rejection and closes back below the channel breakout point, momentum shifts back to the bears. This could trigger a drop toward the Equilibrium Zone near $165 (200 EMA support).
Technical Notes
Golden Fib Zone: $210–$240 — major resistance cluster and potential final hurdle before ATH.
MACD: Positive momentum but nearing a possible signal-line crossover if pullback extends.
RSI: Sitting in the low 70s — still bullish, but in the zone where corrections are common before continuation.
Trend Channel: Clean breakout would signal strong upside continuation if sustained.
Final Thoughts
The next daily close will be key. A strong break into the Golden Fib Zone, followed by a controlled pullback to the $200–$205 range, could set up one of the best swing trades of the quarter, with clear upside into the ATH range.
Patience on entry will be critical — buying after the rejection and retest could offer the best risk/reward.
Disclaimer
The information and publications are not meant to be, and do not constitute, financial, investment, trading, or other types of advice or recommendations supplied or endorsed by TradingView. Read more in the Terms of Use.
Disclaimer
The information and publications are not meant to be, and do not constitute, financial, investment, trading, or other types of advice or recommendations supplied or endorsed by TradingView. Read more in the Terms of Use.