Since the April lows across both equities and crypto markets,  SOL has been one of the standout performers, printing a powerful bullish trend structure defined by two major bull flags — each followed by significant measured-move extensions.
Phase 1 – The First Bull Flag
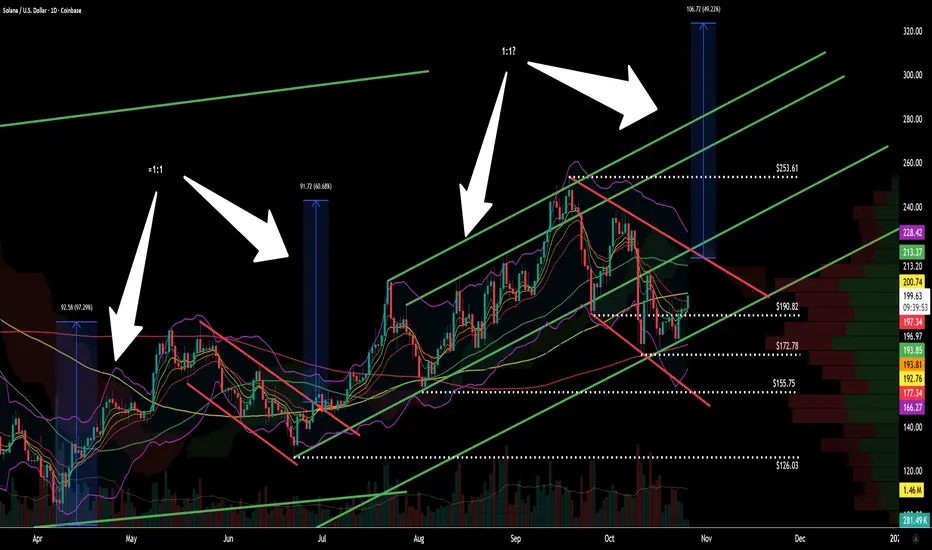
The first rally delivered a 97% gain, followed by a 30% retracement, forming a textbook flag structure.
After a clean breakout and retest of the upper trendline in late June, Solana launched into a 60% measured move, aligning closely with a ≈1:1 projection of the initial flagpole.
This breakout confirmed strong underlying momentum, accompanied by increasing volume and trend confirmation across the broader crypto space.
Phase 2 – The Second Flag Formation
The breakout from the first flag initiated a second 100% run, moving from $126-$253, before undergoing another 30% retracement down to $172.
This pullback mirrors the previous structure almost perfectly, consolidating within another bull flag as the market digests gains.
Currently, price is holding above $190, sitting just beneath the upper flag boundary. The consolidation remains healthy, and if momentum continues to build within this pattern, a volume-backed breakout could lead to a retest of the upper trendline and continuation toward higher levels.
Trend Channel & Structure
The broader move from early June forms a dual-trendline bull channel, where both sets of parallel trendlines are aligned near a 45° slope. This structure reinforces the bullish bias, showing consistent rhythm between impulses and corrections — a strong sign of a well-organized uptrend rather than random volatility.
The pattern also shows proportional price swings, with both measured moves (~1:1) maintaining the same amplitude, suggesting institutional order flow and algorithmic consistency.
Key Levels to Watch
Level Significance
$253.61 Flag target & prior swing high
$213–$214 Local resistance cluster
$190.82 Current support zone (holding above)
$172.78 30% retrace support
$155.75 / $126.03 Structural supports / prior flag bases
A confirmed close above $213–$214 on rising volume would be the first signal that the breakout is underway. Failure to hold $190 would risk extending the flag lower toward the $172 zone.
Measured Move & Projection
If the breakout mirrors the first flag’s performance, a measured move equal to the previous flagpole projects a potential target near $323 — aligning with the upper bound of the extended bull channel.
That projection maintains symmetry with previous rally amplitudes (97%, 60%, ~100%), further validating the trend continuation scenario.
Technical Summary
✅ Trend: Bullish (higher highs & higher lows)
✅ Pattern: Dual bull flags within rising parallel channel
📊 Momentum: Strong; price holding above 8/13 EMA cluster
⚙️ Support: $190 → $172 → $155
🎯 Target: $323 (1:1 projection from current flagpole)
🔍 Trigger: Breakout above top trendline on increased volume
Final Notes
SOL remains technically one of the strongest large-cap crypto charts — clean structure, repeatable patterns, and consistent retracement depth between impulsive legs.
While short-term volatility is expected inside the flag, the 45° upward channel and consistent measured-move behavior keep the medium-term bias bullish through Q4.
As always, volume confirmation will be key, a breakout supported by expanding participation could mark the start of the next leg toward $323.
For educational and technical analysis purposes only.
Phase 1 – The First Bull Flag
The first rally delivered a 97% gain, followed by a 30% retracement, forming a textbook flag structure.
After a clean breakout and retest of the upper trendline in late June, Solana launched into a 60% measured move, aligning closely with a ≈1:1 projection of the initial flagpole.
This breakout confirmed strong underlying momentum, accompanied by increasing volume and trend confirmation across the broader crypto space.
Phase 2 – The Second Flag Formation
The breakout from the first flag initiated a second 100% run, moving from $126-$253, before undergoing another 30% retracement down to $172.
This pullback mirrors the previous structure almost perfectly, consolidating within another bull flag as the market digests gains.
Currently, price is holding above $190, sitting just beneath the upper flag boundary. The consolidation remains healthy, and if momentum continues to build within this pattern, a volume-backed breakout could lead to a retest of the upper trendline and continuation toward higher levels.
Trend Channel & Structure
The broader move from early June forms a dual-trendline bull channel, where both sets of parallel trendlines are aligned near a 45° slope. This structure reinforces the bullish bias, showing consistent rhythm between impulses and corrections — a strong sign of a well-organized uptrend rather than random volatility.
The pattern also shows proportional price swings, with both measured moves (~1:1) maintaining the same amplitude, suggesting institutional order flow and algorithmic consistency.
Key Levels to Watch
Level Significance
$253.61 Flag target & prior swing high
$213–$214 Local resistance cluster
$190.82 Current support zone (holding above)
$172.78 30% retrace support
$155.75 / $126.03 Structural supports / prior flag bases
A confirmed close above $213–$214 on rising volume would be the first signal that the breakout is underway. Failure to hold $190 would risk extending the flag lower toward the $172 zone.
Measured Move & Projection
If the breakout mirrors the first flag’s performance, a measured move equal to the previous flagpole projects a potential target near $323 — aligning with the upper bound of the extended bull channel.
That projection maintains symmetry with previous rally amplitudes (97%, 60%, ~100%), further validating the trend continuation scenario.
Technical Summary
✅ Trend: Bullish (higher highs & higher lows)
✅ Pattern: Dual bull flags within rising parallel channel
📊 Momentum: Strong; price holding above 8/13 EMA cluster
⚙️ Support: $190 → $172 → $155
🎯 Target: $323 (1:1 projection from current flagpole)
🔍 Trigger: Breakout above top trendline on increased volume
Final Notes
While short-term volatility is expected inside the flag, the 45° upward channel and consistent measured-move behavior keep the medium-term bias bullish through Q4.
As always, volume confirmation will be key, a breakout supported by expanding participation could mark the start of the next leg toward $323.
For educational and technical analysis purposes only.
Disclaimer
The information and publications are not meant to be, and do not constitute, financial, investment, trading, or other types of advice or recommendations supplied or endorsed by TradingView. Read more in the Terms of Use.
Disclaimer
The information and publications are not meant to be, and do not constitute, financial, investment, trading, or other types of advice or recommendations supplied or endorsed by TradingView. Read more in the Terms of Use.