## 📊 Chart Overview
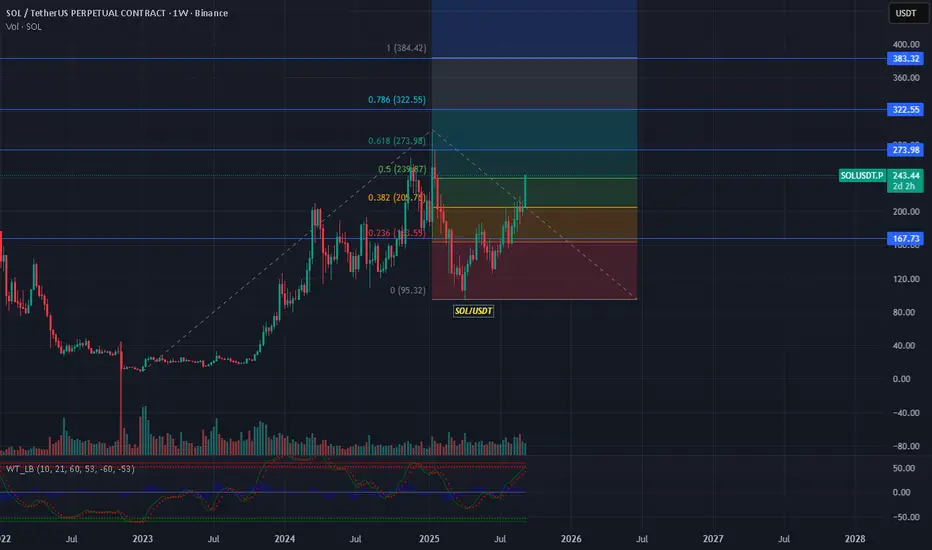
* **Pair:** SOL/USDT (Perpetual Futures, Binance)
* **Current Price:** \$243.44 (+18.01%)
* **Timeframe:** 1W (long-term trend)
* **Volume:** 147.8M (rising, signaling strong participation)
* **Indicators:** Fibonacci retracement, WaveTrend oscillator
---
## 🔑 Fibonacci Levels (swing low \$95.32 → swing high \$384.42)
* **0.236 Fib:** \$163.55 → strong support, successfully defended.
* **0.382 Fib:** \$205.87 → breakout level, now acting as support.
* **0.5 Fib:** \$239.87 → current zone, SOL is testing this level.
* **0.618 Fib:** \$273.98 → next resistance if \$240 holds.
* **0.786 Fib:** \$322.55 → heavy resistance zone.
* **1.0 Fib:** \$384.42 → previous high, potential long-term target.
---
## 📈 Price Action
* SOL has **broken above the \$205 level** and is now consolidating near **\$240**.
* The weekly breakout candle suggests **renewed bullish momentum**.
* Higher lows since the \$95 bottom show a **reversal structure** forming.
---
## 📉 Indicators
* **WaveTrend Oscillator (WT):**
* Currently moving upward, showing **bullish momentum**.
* Entering overbought territory, so short-term corrections are possible.
* **Volume:**
* A surge in weekly volume confirms **strong buying interest**.
---
## 🧭 Outlook
* **Bullish Case:**
* Sustained move above **\$240** opens targets at **\$274 → \$322 → \$384**.
* If momentum extends in a bull cycle, the Fibonacci extension could take SOL toward **\$500–\$560**.
* **Bearish Case:**
* If rejected at \$240–\$245 zone, price may retest **\$205**.
* Failure to hold \$205 could drag it back to **\$167** support.
---
## ⚠️ Risk Note
* SOL is at a **critical mid-Fib level (0.5 zone)**, which often acts as a **decision point**.
* Weekly close above \$240 will confirm strength, but if it fails, downside correction risk rises.
* Always track Bitcoin’s movement since SOL is highly correlated.
---
✅ **Summary:**
SOL is in a **bullish breakout phase**, reclaiming the \$240 zone. Holding above this level can accelerate a rally toward **\$274–\$322**, while failure may bring a pullback to **\$205–\$167**.
Disclaimer
The information and publications are not meant to be, and do not constitute, financial, investment, trading, or other types of advice or recommendations supplied or endorsed by TradingView. Read more in the Terms of Use.
Disclaimer
The information and publications are not meant to be, and do not constitute, financial, investment, trading, or other types of advice or recommendations supplied or endorsed by TradingView. Read more in the Terms of Use.