SMC Trading point update
Technical analysis of SOL/USDT (1-hour timeframe) — a potential continuation move within an ascending channel.
Here’s the complete breakdown
---
1. Market Structure
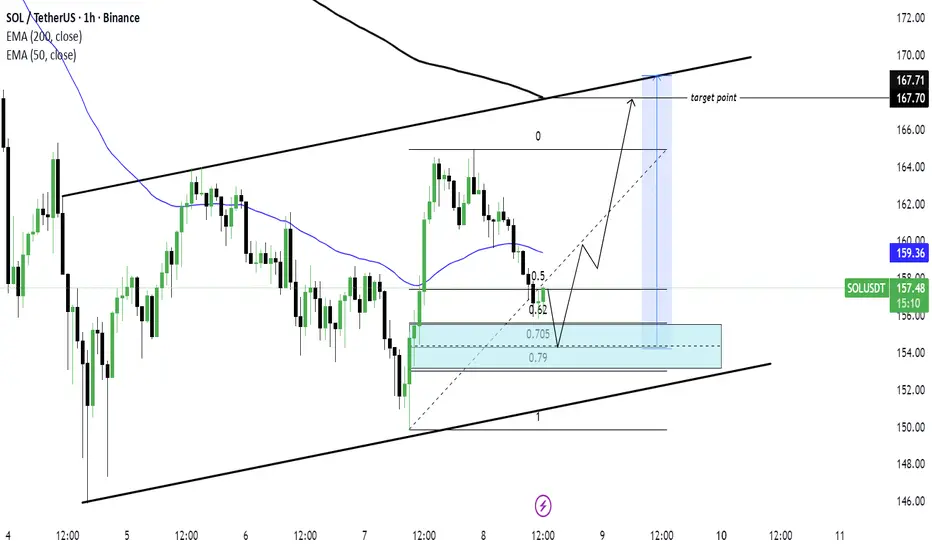
Price is moving inside a rising channel, confirming a bullish structure with higher highs and higher lows.
The two black trendlines outline this ascending pattern, indicating overall upward momentum.
---
2. Key Zone (Demand Area)
The blue box marks a demand or buy zone around $154–$155.5, aligned with the Fibonacci retracement levels (0.62–0.79).
This zone represents a potential retracement area where buyers may step in to continue the uptrend.
---
3. EMAs as Dynamic Support/Resistance
50 EMA (blue line) = $159.36
200 EMA (black line) = $167.71
Price is currently below the 50 EMA but still above the mid-channel trendline, suggesting temporary correction before continuation.
Once SOL bounces from the demand zone, reclaiming the 50 EMA would confirm momentum shift back to bullish.
---
4. Expected Move
The chart projects a short-term pullback into the demand zone (0.705–0.79 retracement).
From there, a bullish reversal is expected, leading to a continuation toward the upper boundary of the channel.
Target point: Around $167.7, matching the 200 EMA and channel resistance.
---
5. Summary
Trend: Bullish (ascending channel)
Bias: Buy the dip / Continuation upward
Entry Zone: $154 – $155.5 (blue demand zone)
Target: $167 – $168
Invalidation: Break below channel support (~$150)
---
Trading Idea Summary:
“SOL remains in a bullish channel. Price is retracing toward the 0.705–0.79 Fibonacci demand zone, where buyers are likely to re-enter. A bounce from this area could trigger a continuation move toward the $167 resistance zone.”
---
please support boost 🚀 this analysis
Technical analysis of SOL/USDT (1-hour timeframe) — a potential continuation move within an ascending channel.
Here’s the complete breakdown
---
1. Market Structure
Price is moving inside a rising channel, confirming a bullish structure with higher highs and higher lows.
The two black trendlines outline this ascending pattern, indicating overall upward momentum.
---
2. Key Zone (Demand Area)
The blue box marks a demand or buy zone around $154–$155.5, aligned with the Fibonacci retracement levels (0.62–0.79).
This zone represents a potential retracement area where buyers may step in to continue the uptrend.
---
3. EMAs as Dynamic Support/Resistance
50 EMA (blue line) = $159.36
200 EMA (black line) = $167.71
Price is currently below the 50 EMA but still above the mid-channel trendline, suggesting temporary correction before continuation.
Once SOL bounces from the demand zone, reclaiming the 50 EMA would confirm momentum shift back to bullish.
---
4. Expected Move
The chart projects a short-term pullback into the demand zone (0.705–0.79 retracement).
From there, a bullish reversal is expected, leading to a continuation toward the upper boundary of the channel.
Target point: Around $167.7, matching the 200 EMA and channel resistance.
---
5. Summary
Trend: Bullish (ascending channel)
Bias: Buy the dip / Continuation upward
Entry Zone: $154 – $155.5 (blue demand zone)
Target: $167 – $168
Invalidation: Break below channel support (~$150)
---
Trading Idea Summary:
“SOL remains in a bullish channel. Price is retracing toward the 0.705–0.79 Fibonacci demand zone, where buyers are likely to re-enter. A bounce from this area could trigger a continuation move toward the $167 resistance zone.”
---
please support boost 🚀 this analysis
Trade closed: target reached
(Services:✔️ JOIN Telegram channel
t.me/SMCTrading_point
Gold trading signals 🚀 99%
t.me/SMCTrading_point
Join my recommended broker , link 👇
World best broker exness ✅D
one.exnesstrack.org/a/l1t1rf3p6v
t.me/SMCTrading_point
Gold trading signals 🚀 99%
t.me/SMCTrading_point
Join my recommended broker , link 👇
World best broker exness ✅D
one.exnesstrack.org/a/l1t1rf3p6v
Disclaimer
The information and publications are not meant to be, and do not constitute, financial, investment, trading, or other types of advice or recommendations supplied or endorsed by TradingView. Read more in the Terms of Use.