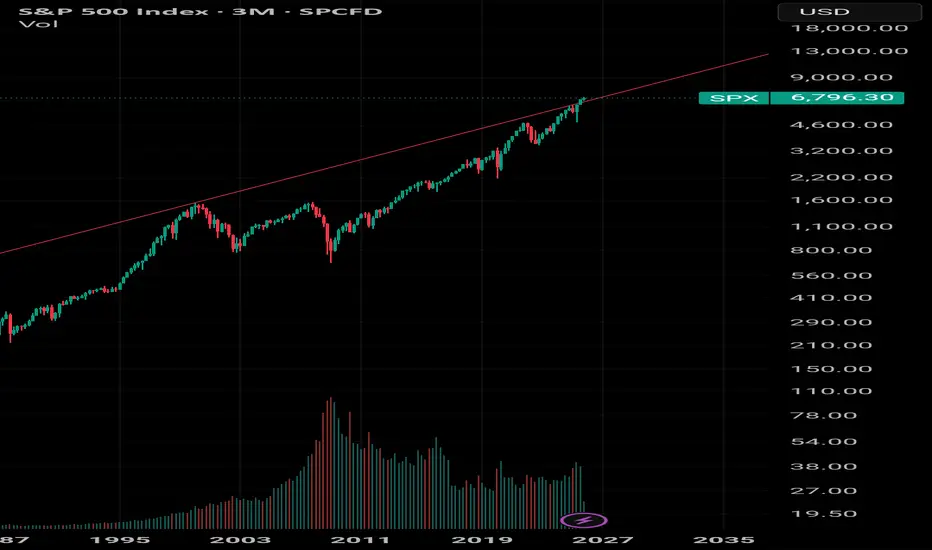
I love going back to this chart which tells us everything we need to know when asking the question why is buffet sitting in so much cash. It's an amazing chart and you can see what will Happen, what needs to happen but not when. Needless to say we are still above the red line.
Disclaimer
The information and publications are not meant to be, and do not constitute, financial, investment, trading, or other types of advice or recommendations supplied or endorsed by TradingView. Read more in the Terms of Use.
Disclaimer
The information and publications are not meant to be, and do not constitute, financial, investment, trading, or other types of advice or recommendations supplied or endorsed by TradingView. Read more in the Terms of Use.