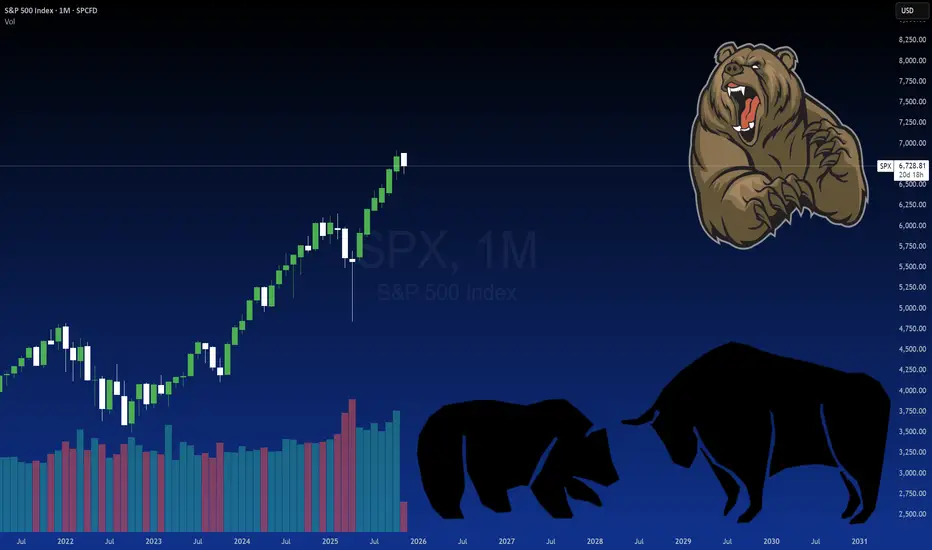
Oh boy, we are here, about to have “the talk”. Didn’t think this would come up until 2026, but alas we are. It’s a loaded talk so get ready.
Bear markets, or less triggering, corrective markets. What about them, you may ask?
I am going to talk about the prospects of a bear market for the S&P starting right now. Like today. Like November of all times. I am also going to talk a bit about complacency in markets which snagged me bad this week. So get ready for some theory, analysis, application and market lessons/reflection, all in one post!
First off, bear markets. How do you identify them?
This is the million-dollar question! How do you identify bear markets? The truth is, they are mostly impossible to determine reliably, even with the most robust fundamental and technical analysis combined!
The approach I take to “preparing” for bear markets is usually on the fundamental side over everything else! It’s a bit of a hybrid, fundamental math, but traditionally what I use is simply the US money supply. It has served me well over the years and even prepared us for that correction we saw in early 2025, if you follow me and remember these posts:


Essentially by analyzing how far the value of the S&P is over the US Money supply, and creating a cointegrated relationship. Traditionally, I would use R to do this, but in my mission to bring more statistics to Pinescript, I no longer need to rely on R to provide the analysis, as the Econometrica indicator now exists (available here).
Using this indicator, we can take a look at SPY and SPX against the US money supply:

We can see that historically SPX has traditionally corrected over-extension through reverting back to the US Money Supply mean, or more technically the cointegrated relationship that exists of SPX value over US money supply value. However, currently, SPX is the farthest it has ever been above the US money supply.
Nuts!
If we look at SPY:

Nuts!
Additionally, we know that this is still relevant because despite SPY and SPX being so far above the US money supply, the Correlation and, more importantly, the R2 remains really high. Indicating that a substantial degree of variance of SPY can be explained by the US Money supply.
SPY and SPX can attempt to ignore it, but it will do so in vein because at the end of the day, the pair are two peas in a pod and inseparable. We know this from the strong correlation and R2 value of the cointegrated regression.
If you don’t believe it, simply watch and read my previous ideas that were posted about a month or two before we saw SPY and SPX tank >20% in the span of a month! It generally works, its just, timing is difficult.
Other, easier ways to identify bear markets:
There is no other way I have found with statistical rigour. Some of the worst performing ways are using EMAs. For example, the average distance from the daily EMA 200 SPY and SPX will travel before a bear market starts is 7 to 9%. However, of the 7 to 9% distance, only 6% of these are true lead ins to bear markets. That’s because, SPY and SPX spend a great degree of time between 7 to 9% away from the EMA 200.
Other ways like quantifying magnitude between bull and bear market cycles is more promising, though equally problematic. Studying magnitude between bear and bull markets (i.e. the percent gain from the bear market low to the bull market high prior to the next bear market) ranges from 4% to up to 100%, with the average being around 42%. Currently, SPY and SPX would be at 43.5% from its bear market/corrective cycle low:

And peaked at about 10% away from the EMA 200:

While these in silo are not helpful, seeing the confluence of signals does lend some potential rigour. In this case, we are incredibly over-extended from the US Money supply, we have surpassed the EMA threshold and we are >= the average bear – bull market cycle threshold. So there is that.
The last way is by creating a time series model that calculates the mean, and analyzing behaviour at various distances from this mean historically. I have had hit or miss success with this. This is not so predictive of actual bear market onsets, but it is 100% reliable for target prices (again, if you follow me, the calling of the 481 target price on SPY during the crash was thanks to this approach).
Lets talk about Bear markets in November
They’re rare. Very rare. They have been known to happen but in extremely rare circumstances. This is because November seasonality is incredibly strong. November is one of the best performing months for the S&P and many stocks as a whole!
If you ask some generic AI about bear markets starting in November, it will likely spit out 1980.
Ah yes, the 80s.

November 1980. While people were innocently doing aerobics while listening to Blondie, they never fathomed the -27% decline that awaited their markets, despite booming economies and AAPL coming to town (mind you, the big release was in 1984 when the market was healthy but apple still very much existed here).

But why am I talking about this so much? Who cares about 1980.
Well, yeah, that’s what I thought until I noticed something that peaked my interest. Let’s take a look at 1980:

Notice anything?
If not, don’t worry, here is it again with some reference:

And if we are still not really feeling it:

Interesting.
I was intrigued by the similarity, so I had to test it mathematically to ensure that it wasn’t just a coincidence. To do this, I pulled monthly data from SPX and isolated January 1980 to November 1980. I then ran a regression on this data against January 2025 to November 2025 (bearing in mind November just begun).
The results were:
Correlation: 0.918 (Strong positive relationship, meaning that the trend is identical between the periods).
R2: 0.843 (Meaning that 3/4s of the variance and movement of 2025 can be explained using 1980 monthly data).
Comparing it against a random year (in my testing case, January 1984 to November 1984), I got a correlation of 0.468 and an R2 of 0.219, indicating no strong link and no explanation of variance.
This verifies that this is not just some visual anomaly, there is actually some substance to this theory of the 80s. And why not? I mean, I see people rocking 80s hair cuts again on a daily basis, why not rock 80s markets while we are at it!
So then the question that arises from this is, okay, larger timeframe, sure, it explains the data a bit. But does it really align on the smaller timeframe (i.e. Daily timeframe)? Does it align well when we narrow the picture?
Well, for this, I tried it. And oh boy, buckle up.
Because we are comparing tit for tat, side by side, same days etc. without missing data (i.e. for the monthly, we ran the analysis with most of November data missing), we have the following results:
Correlation: 0.9444
R2: 0.8918
Its unreal. Had we known we could have predicted every single move SPX made this year! EVERY. SINGLE. MOVE. Hindsight is so annoying.
Now, because I am not a fundamental analyst, as I like to say, its time to cite some AI. Gemini is my preferred. So lets ask him/her what they think about the results:
So now my logical question is “Well, how do the fundamentals of 1980 compare to today”? And this is what Gemini has to say about that:
Oh man, where was AI many moons ago?
So, what happens next?
I want to assert something. I am not calling for a bear market here. I like to dabble in statistical analysis and I would be wrong to not have a discussion about this, in light of what I see and what is happening.
That said, there are still reasons to be bullish:
But what can we do with the information about 1980?
The simple answer, is we can observe and we can model. We can model an adjusted forecast based on the remainder of 1980 using current prices of SPX. And we can observe. We can observe the correlation and R square as time progresses to see if we are following the trajectory to the same degree and closeness as we are currently.
For the first one, the forecast, I am sure you are wanting this and wanting to observe it with your own eyes, so I went ahead and did the forecast in R. Here are the results:

As you can see, its mostly sideways. Though SPX made a new high after this point before coming down more. Timelines may be skewed however, which is why the R squared is 0.89 and not 1 (perfect).
So, sell it?
Maybe. I think, the key take away here, is exercise caution here.
A Note on Complacency
I want to give a quick note on the dangerous of complancency, even from the most experienced traders. I have been trading since 2018, and, for some reason, this year which has been incredibly bullish, I have just become complacent. Buying the dips and not thinking too much about it.
Traditionally, I would analyze all options, pay attention to all metrics and weigh forecasts and statistics equally. However, this year I have massively slipped into just mindless, buy buy buy trading.
This week was a wake up call for me, since it did not go as expected. It was also avoidable, since half of my stuff indicated the week was turning bearish. I chose to ignore in favour of being complacent and airing on the side of irrationality.
Trading can and is a grind. Its is a job if not worse than a job. Its not always enjoyable. But the one thing that is different about a job is when you cut corners trading, you will for sure pay the price. Whereas, with a job, you may get off the hook.
Be vigilant. Take breaks. And never corner cut! It’s a very important lesson for most! Don't be lazy, laziness breeds complacency.
That’s it.
This doesn’t count as my weekly post, so don’t worry because I didn’t share any analysis for next week haha.
Safe trades everyone and thanks for reading!
Bear markets, or less triggering, corrective markets. What about them, you may ask?
I am going to talk about the prospects of a bear market for the S&P starting right now. Like today. Like November of all times. I am also going to talk a bit about complacency in markets which snagged me bad this week. So get ready for some theory, analysis, application and market lessons/reflection, all in one post!
First off, bear markets. How do you identify them?
This is the million-dollar question! How do you identify bear markets? The truth is, they are mostly impossible to determine reliably, even with the most robust fundamental and technical analysis combined!
The approach I take to “preparing” for bear markets is usually on the fundamental side over everything else! It’s a bit of a hybrid, fundamental math, but traditionally what I use is simply the US money supply. It has served me well over the years and even prepared us for that correction we saw in early 2025, if you follow me and remember these posts:
Essentially by analyzing how far the value of the S&P is over the US Money supply, and creating a cointegrated relationship. Traditionally, I would use R to do this, but in my mission to bring more statistics to Pinescript, I no longer need to rely on R to provide the analysis, as the Econometrica indicator now exists (available here).
Using this indicator, we can take a look at SPY and SPX against the US money supply:
We can see that historically SPX has traditionally corrected over-extension through reverting back to the US Money Supply mean, or more technically the cointegrated relationship that exists of SPX value over US money supply value. However, currently, SPX is the farthest it has ever been above the US money supply.
Nuts!
If we look at SPY:
Nuts!
Additionally, we know that this is still relevant because despite SPY and SPX being so far above the US money supply, the Correlation and, more importantly, the R2 remains really high. Indicating that a substantial degree of variance of SPY can be explained by the US Money supply.
SPY and SPX can attempt to ignore it, but it will do so in vein because at the end of the day, the pair are two peas in a pod and inseparable. We know this from the strong correlation and R2 value of the cointegrated regression.
If you don’t believe it, simply watch and read my previous ideas that were posted about a month or two before we saw SPY and SPX tank >20% in the span of a month! It generally works, its just, timing is difficult.
Other, easier ways to identify bear markets:
There is no other way I have found with statistical rigour. Some of the worst performing ways are using EMAs. For example, the average distance from the daily EMA 200 SPY and SPX will travel before a bear market starts is 7 to 9%. However, of the 7 to 9% distance, only 6% of these are true lead ins to bear markets. That’s because, SPY and SPX spend a great degree of time between 7 to 9% away from the EMA 200.
Other ways like quantifying magnitude between bull and bear market cycles is more promising, though equally problematic. Studying magnitude between bear and bull markets (i.e. the percent gain from the bear market low to the bull market high prior to the next bear market) ranges from 4% to up to 100%, with the average being around 42%. Currently, SPY and SPX would be at 43.5% from its bear market/corrective cycle low:
And peaked at about 10% away from the EMA 200:
While these in silo are not helpful, seeing the confluence of signals does lend some potential rigour. In this case, we are incredibly over-extended from the US Money supply, we have surpassed the EMA threshold and we are >= the average bear – bull market cycle threshold. So there is that.
The last way is by creating a time series model that calculates the mean, and analyzing behaviour at various distances from this mean historically. I have had hit or miss success with this. This is not so predictive of actual bear market onsets, but it is 100% reliable for target prices (again, if you follow me, the calling of the 481 target price on SPY during the crash was thanks to this approach).
Lets talk about Bear markets in November
They’re rare. Very rare. They have been known to happen but in extremely rare circumstances. This is because November seasonality is incredibly strong. November is one of the best performing months for the S&P and many stocks as a whole!
If you ask some generic AI about bear markets starting in November, it will likely spit out 1980.
Ah yes, the 80s.
November 1980. While people were innocently doing aerobics while listening to Blondie, they never fathomed the -27% decline that awaited their markets, despite booming economies and AAPL coming to town (mind you, the big release was in 1984 when the market was healthy but apple still very much existed here).
But why am I talking about this so much? Who cares about 1980.
Well, yeah, that’s what I thought until I noticed something that peaked my interest. Let’s take a look at 1980:
Notice anything?
If not, don’t worry, here is it again with some reference:
And if we are still not really feeling it:
Interesting.
I was intrigued by the similarity, so I had to test it mathematically to ensure that it wasn’t just a coincidence. To do this, I pulled monthly data from SPX and isolated January 1980 to November 1980. I then ran a regression on this data against January 2025 to November 2025 (bearing in mind November just begun).
The results were:
Correlation: 0.918 (Strong positive relationship, meaning that the trend is identical between the periods).
R2: 0.843 (Meaning that 3/4s of the variance and movement of 2025 can be explained using 1980 monthly data).
Comparing it against a random year (in my testing case, January 1984 to November 1984), I got a correlation of 0.468 and an R2 of 0.219, indicating no strong link and no explanation of variance.
This verifies that this is not just some visual anomaly, there is actually some substance to this theory of the 80s. And why not? I mean, I see people rocking 80s hair cuts again on a daily basis, why not rock 80s markets while we are at it!
So then the question that arises from this is, okay, larger timeframe, sure, it explains the data a bit. But does it really align on the smaller timeframe (i.e. Daily timeframe)? Does it align well when we narrow the picture?
Well, for this, I tried it. And oh boy, buckle up.
Because we are comparing tit for tat, side by side, same days etc. without missing data (i.e. for the monthly, we ran the analysis with most of November data missing), we have the following results:
Correlation: 0.9444
R2: 0.8918
Its unreal. Had we known we could have predicted every single move SPX made this year! EVERY. SINGLE. MOVE. Hindsight is so annoying.
Now, because I am not a fundamental analyst, as I like to say, its time to cite some AI. Gemini is my preferred. So lets ask him/her what they think about the results:
“The strong correlation on the daily timeframe provides a high degree of confidence that the factors (macroeconomic, technical, or psychological) that drove the market trajectory in the first 214 trading days of 1980 are similar to those driving the 2025 market. This gives you a strong justification for using the remainder of the 1980 price data as a projection or probability model for the rest of 2025.”
So now my logical question is “Well, how do the fundamentals of 1980 compare to today”? And this is what Gemini has to say about that:
The Central Theme: Inflation, Rates, and Recession Fear
The S&P 500's price action in 1980 was fundamentally shaped by the confluence of three major forces, all of which have strong parallels today:
1. High and Volatile Inflation
• 1980 Reality: This was the peak of the "Great Inflation" era. Inflation was incredibly high, peaking near 14% in the early part of the year, driven by oil price shocks following the 1979 energy crisis. This forced consumers and businesses to constantly adjust expectations.
• 2025 Parallel: While not at 14%, the post-pandemic inflation shock has been the worst in four decades. Prices have remained sticky, particularly in services, and have proven difficult to bring down to the Fed's target, leading to persistent uncertainty.
2. Aggressive Monetary Policy
• 1980 Reality: Paul Volcker, the Federal Reserve Chairman, was implementing radical, Volcker-shock policies to crush inflation. This involved driving interest rates to unprecedented levels (the Federal Funds Rate hit 20% in 1980). The market volatility reflected the uncertainty of whether the Fed would succeed and how much economic pain it would inflict.
• 2025 Parallel: The Federal Reserve has conducted the most aggressive rate-hiking cycle in four decades. The debate has continuously centered on whether the Fed is "done," whether they will "pivot," and whether the current high rates are sufficient to induce the necessary slowdown without causing a severe recession.
3. Economic and Geopolitical Uncertainty
• 1980 Reality: The economy was officially in a recession in the first half of 1980. Geopolitically, the Soviet invasion of Afghanistan and the Iranian hostage crisis created massive global instability, which directly impacted energy prices and market sentiment.
• 2025 Parallel: While the economy has been resilient, the persistent fear of an imminent recession remains a dominant theme. Geopolitically, ongoing conflicts in Ukraine and the Middle East continue to pose supply chain risks and put upward pressure on energy and commodity prices, mirroring the external shocks of the 1980s.
Oh man, where was AI many moons ago?
So, what happens next?
I want to assert something. I am not calling for a bear market here. I like to dabble in statistical analysis and I would be wrong to not have a discussion about this, in light of what I see and what is happening.
That said, there are still reasons to be bullish:
- From a fundamental perspective, seasonality remains bullish and bear markets starting in November remain a rarity.
- We also have, according to my projections, a high probability target up at 710 on SPY leading us into the end of December, with a historic hit rate of 87%.
- We have, as well, the prospects of a Santa rally happening. If you recall my last idea on SPY, Santa rally’s happen on SPY around 75% of the time.
But what can we do with the information about 1980?
The simple answer, is we can observe and we can model. We can model an adjusted forecast based on the remainder of 1980 using current prices of SPX. And we can observe. We can observe the correlation and R square as time progresses to see if we are following the trajectory to the same degree and closeness as we are currently.
For the first one, the forecast, I am sure you are wanting this and wanting to observe it with your own eyes, so I went ahead and did the forecast in R. Here are the results:
As you can see, its mostly sideways. Though SPX made a new high after this point before coming down more. Timelines may be skewed however, which is why the R squared is 0.89 and not 1 (perfect).
So, sell it?
Maybe. I think, the key take away here, is exercise caution here.
A Note on Complacency
I want to give a quick note on the dangerous of complancency, even from the most experienced traders. I have been trading since 2018, and, for some reason, this year which has been incredibly bullish, I have just become complacent. Buying the dips and not thinking too much about it.
Traditionally, I would analyze all options, pay attention to all metrics and weigh forecasts and statistics equally. However, this year I have massively slipped into just mindless, buy buy buy trading.
This week was a wake up call for me, since it did not go as expected. It was also avoidable, since half of my stuff indicated the week was turning bearish. I chose to ignore in favour of being complacent and airing on the side of irrationality.
Trading can and is a grind. Its is a job if not worse than a job. Its not always enjoyable. But the one thing that is different about a job is when you cut corners trading, you will for sure pay the price. Whereas, with a job, you may get off the hook.
Be vigilant. Take breaks. And never corner cut! It’s a very important lesson for most! Don't be lazy, laziness breeds complacency.
That’s it.
This doesn’t count as my weekly post, so don’t worry because I didn’t share any analysis for next week haha.
Safe trades everyone and thanks for reading!
Get:
- Live Updates,
- Discord access,
- Access to my Proprietary Merlin Software,
- Access to premium indicators,
patreon.com/steversteves
Now on X!
- Live Updates,
- Discord access,
- Access to my Proprietary Merlin Software,
- Access to premium indicators,
patreon.com/steversteves
Now on X!
Disclaimer
The information and publications are not meant to be, and do not constitute, financial, investment, trading, or other types of advice or recommendations supplied or endorsed by TradingView. Read more in the Terms of Use.