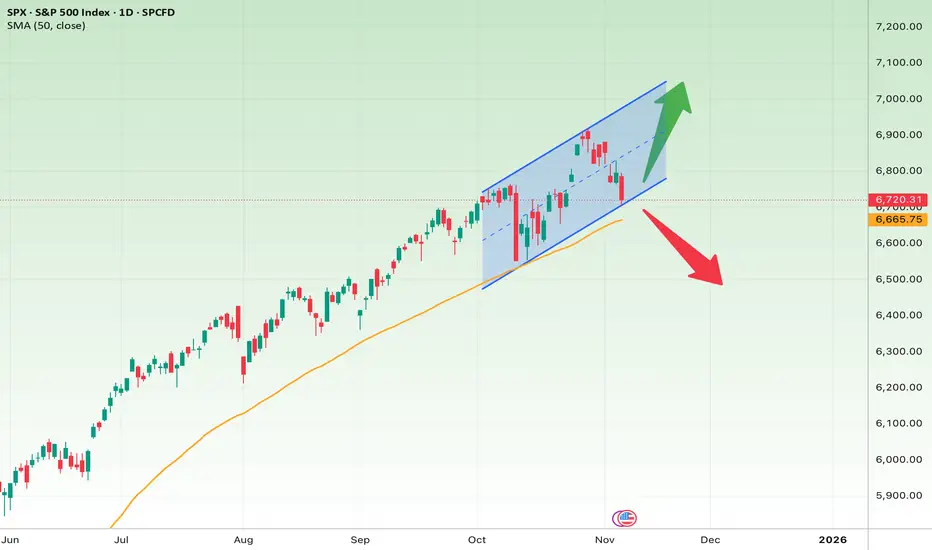
The S&P 500 is moving within a well-defined ascending channel on the daily timeframe. After touching the top of the channel, the index entered a short-term correction and is now testing the mid-channel area and the 50-day moving average (around 6,665) — both key support zones.
Short-Term Outlook (next few days to weeks)
If the index holds above 6,660–6,700 and starts to rebound, the next target would likely be the 6,950–7,000 resistance area near the top of the channel.
However, if 6,650 breaks and the price closes below it, a deeper pullback toward 6,450 or even 6,300 could follow.
• Bullish target: 6,950–7,000
• Bullish stop loss: Below 6,650
• Bearish target: 6,450–6,300
• Bearish stop loss: Above 6,800
Mid-Term Outlook (1–3 months)
The broader trend remains bullish, as the 50-day moving average still slopes upward. As long as the price stays above this line, the market structure remains positive.
If the upward channel holds, the next potential targets lie between 7,100 and 7,200.
But a confirmed breakdown below 6,650 could signal a shift in momentum toward a larger correction.
• Bullish mid-term target: 7,100–7,200
• Mid-term stop loss: Below 6,650
Summary:
The 6,660–6,700 range is the key zone to watch:
• Holding above it → continuation of the uptrend toward the channel’s upper boundary
• Breaking below it → possible decline toward the lower channel or deeper correction
In short, this area acts as the line between continuation and correction for the S&P 500.
Disclaimer
The information and publications are not meant to be, and do not constitute, financial, investment, trading, or other types of advice or recommendations supplied or endorsed by TradingView. Read more in the Terms of Use.
Disclaimer
The information and publications are not meant to be, and do not constitute, financial, investment, trading, or other types of advice or recommendations supplied or endorsed by TradingView. Read more in the Terms of Use.