Introduction
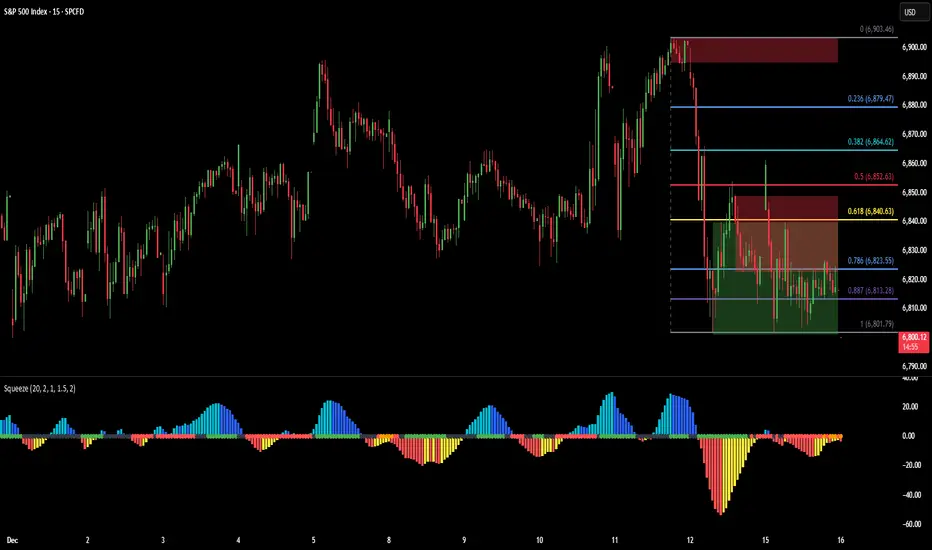
This 15-minute SPX chart provides a structural view of price action for December to date, focusing on range behavior, Fibonacci context, supply/demand interaction, and volatility conditions rather than directional prediction.
Prior Week Context
SPX recently completed a sharp downside impulse from the upper end of the monthly range, followed by a retracement and subsequent compression. The prior week produced a wide range expansion, with price failing to sustain acceptance near the highs and rotating lower into value.
Current Fibonacci Framework
The active Fibonacci retracement remains anchored to the most recent impulse leg. Price has been unable to reclaim the 0.618 retracement and is currently accepting between the 0.786 and 0.887 levels, suggesting balance rather than continuation at this stage. This zone represents a decision area where follow-through has diminished.
Supply and Demand Context
Overhead supply remains defined near the upper retracement levels, while demand is present below current price, forming a compressed range. Price is currently oscillating within this structure, consistent with post-impulse digestion rather than trend resolution.
Momentum and Volatility
The squeeze histogram reflects a transition from strong negative momentum into contraction, indicating volatility compression following expansion. This environment typically favors rotational behavior and patience until acceptance or rejection becomes clear.
Structural Takeaway
From a market structure perspective, resolution likely requires either:
Acceptance back above the mid-range retracements, or
Rejection from the current balance area with renewed momentum.
Until then, the chart reflects context and structure, not directional conviction.
The goal is to frame market context first, allowing structure and volatility to define expectations before bias.
This analysis is intended for educational and informational purposes, emphasizing market structure and volatility context rather than trade signals.
The Volatility Engine — Real-time SPX analytics built to help disciplined traders interpret market structure, volatility context, and directional strength as price evolves. A unified decision-support framework. Inquiries: TheVolatilityEngines.com
Disclaimer
The information and publications are not meant to be, and do not constitute, financial, investment, trading, or other types of advice or recommendations supplied or endorsed by TradingView. Read more in the Terms of Use.