HERE'S WHAT IT MEANS FOR YOUR PORTFOLIO
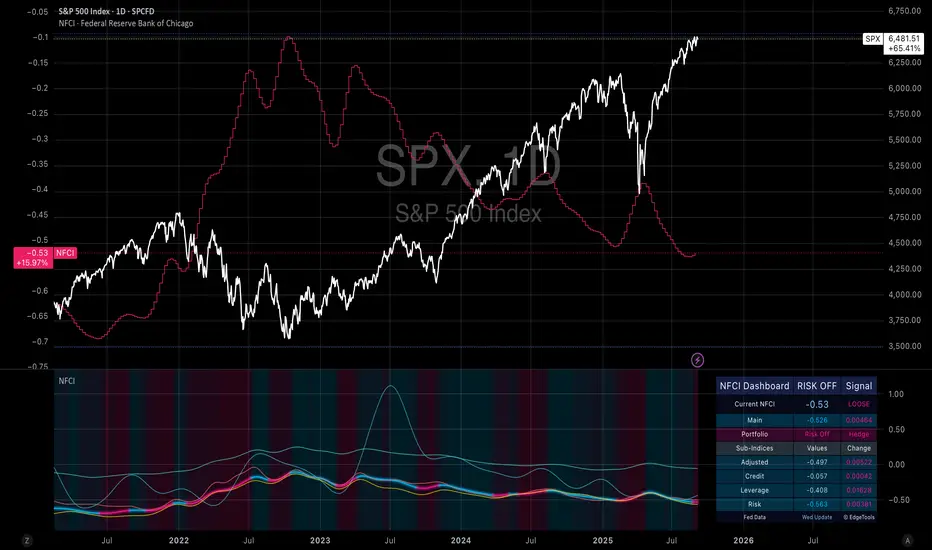
The National Financial Conditions Index from the Chicago Federal Reserve has sent a clear signal this week: financial market conditions are deteriorating. After months of relative calm at a level of -0.53, the index rose on Wednesday, triggering the first "Risk Off" signal in an extended period. For institutional investors and risk-conscious traders, this is a moment that deserves attention.
The NFCI is not just another technical indicator. It represents the most comprehensive assessment of American financial market conditions available. Over 100 different data points flow into its calculation: from credit conditions to volatility measures to banking sector stress indicators. When this index rises, it means liquidity conditions are deteriorating, credit risks are increasing, and financial market stability is under pressure.
The historical evidence is clear. Both in 2008 and 2020, NFCI increases warned weeks before major market crashes of deteriorating conditions. The strategy of building defensive positions during NFCI rises has proven its effectiveness over long periods. While it doesn't deliver the spectacular returns of a pure buy-and-hold approach, it offers something far more valuable: capital protection in critical moments.
BASE CASE SCENARIO
Our base case assumes that the current NFCI rise marks the beginning of a typical correction phase. Historical data shows that such signals typically anticipate market declines of 10 to 15 percent over a period of three to six months. The correction would be driven by a combination of tighter credit conditions, increased volatility, and diminishing investor risk appetite.
In this scenario, we expect the S&P 500 to retreat from its current level of approximately 6,470 points to a level between 5,500 and 5,800 points. This would correspond to a decline of about 10 to 15 percent, equivalent to a normal, healthy correction in an otherwise intact bull market. Recovery would begin once the NFCI starts falling again, signaling that financial market conditions are relaxing.
This scenario is supported by the fact that the American economy remains fundamentally robust. Unemployment is low, corporate earnings continue to grow, and the Federal Reserve still has room for monetary policy support. A moderate decline would correct overvalued areas of the market without triggering a systemic crisis.
WORST CASE SCENARIO
The more pessimistic scenario considers the possibility that the current NFCI rise is the beginning of a more serious financial market disruption. In this case, the index could continue deteriorating and reach values historically associated with genuine financial crises. A sustained rise over several weeks, especially if the NFCI reaches positive values, would indicate systemic problems.
In this scenario, we would have to expect a market decline of 25 to 40 percent extending over 12 to 18 months. The S&P 500 would fall to levels between 3,900 and 4,900 points in this case. Such movements typically arise from a combination of credit squeeze, liquidity shortages, and self-reinforcing selling spirals.
The triggers for such a scenario could be diverse: an unexpected escalation of the geopolitical situation, the bursting of a speculation bubble in an important market segment, or a revaluation of credit risks in the banking sector. The worst-case scenario would also mean that the Federal Reserve would have to respond with aggressive measures, which in turn could lead to longer-term structural changes in monetary policy.
POSITIONING STRATEGY
Given these scenarios, a graduated defense strategy is appropriate. The first line of defense consists of reducing existing long positions and taking profits. This is particularly important for overvalued growth stocks that suffer disproportionately in correction phases.
The second stage involves building direct hedging positions. Put options on the S&P 500 with maturities of three to six months offer cost-effective protection against larger declines. Strike prices between 10 and 20 percent below the current market level should be chosen to achieve a balanced ratio between costs and protective effect.
For more aggressive traders, direct short positions are also available, but with strict risk management. Short positions should not exceed 5 to 10 percent of the total portfolio and must be closed immediately upon a reversal of the NFCI signal.
TIMING AND EXIT STRATEGY
Timing is crucial for NFCI-based strategies. The index is updated only once weekly, meaning signals don't immediately react to daily market movements. However, this is a feature, not a bug. The weekly frequency filters out market noise and focuses on substantial changes in financial market conditions.
The exit strategy is as important as the entry. As soon as the NFCI begins falling again, defensive positions should be gradually reduced. A decline of the index below its previous low would represent a clear "Risk On" signal and justify building new long positions.
It's particularly important not to try to catch the absolute bottom. The NFCI strategy is designed to capture the big moves, not to trade every small fluctuation. Patience and discipline are more important here than precision.
The current NFCI rise is a warning signal that should be taken seriously. While we cannot predict with certainty whether we are at the beginning of a small correction or a larger bear market, the historical evidence justifies defensive positioning. The combination of profit-taking, hedging strategies, and increased liquidity provides the best possible protection against the uncertainties that may lie ahead.
At a time when many investors are blinded by ongoing market euphoria, the NFCI reminds us that markets are cyclical and that caution is often the better part of valor. Those who position defensively today will have the flexibility tomorrow to act from a position of strength when better opportunities arise again.
Trade closed manually
I closed my short position in the ES based on the latest update to the Chicago Fed National Financial Conditions Index (NFCI). The index has moved back into negative territory, which signals easing financial conditions. This environment tends to support risk assets, reducing the probability of further downside in equities.It is also worth noting that data revisions from FRED are a normal part of the reporting process. Initial releases are often based on preliminary inputs, which get updated as more complete information becomes available. The revised values provide a more accurate picture of current financial conditions and should be viewed as standard practice rather than an anomaly.
Where others speculate, we systematize.
edgetools.org
edgetools.org
Disclaimer
The information and publications are not meant to be, and do not constitute, financial, investment, trading, or other types of advice or recommendations supplied or endorsed by TradingView. Read more in the Terms of Use.
Where others speculate, we systematize.
edgetools.org
edgetools.org
Disclaimer
The information and publications are not meant to be, and do not constitute, financial, investment, trading, or other types of advice or recommendations supplied or endorsed by TradingView. Read more in the Terms of Use.