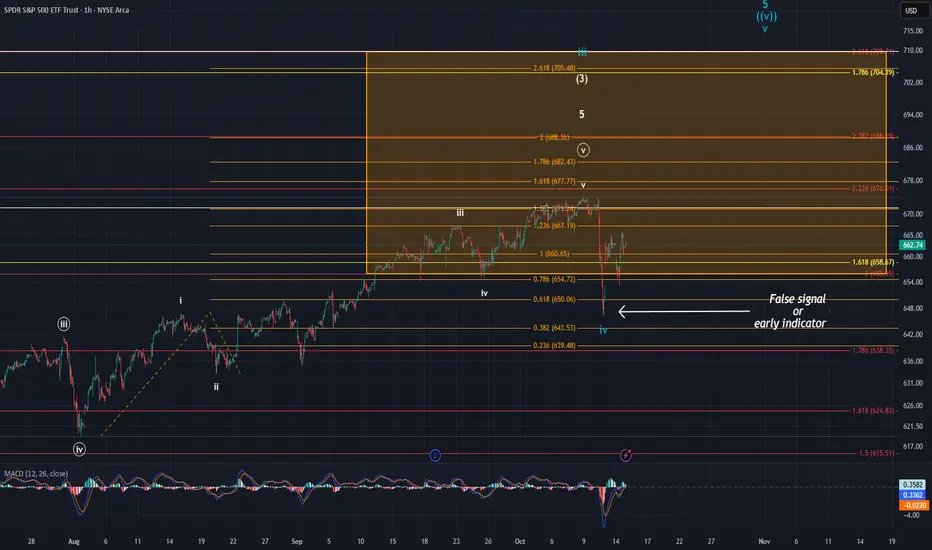
There is a lot to unpack with SPY. We have been searching for the intermediate wave (3) for some time now. The drop on Friday is what complicated things. I was originally thinking that we needed another wave iv and v to finish off this move higher. In the SPY ETF, however, the drop in price overlapped the wave i high made on 15 August. This would obviously rule out another high being made and would suggest that wave (4) kicked off pointing us lower. When you look at the SPX & ES though, price did not overlap with the wave i high. SPY is a derivative of the S&P and could be sending a false signal. On the flip side of that, it could be an early indicator that the SPX will only get a slight high before kicking off wave (4).
The simplest way I can explain this, is the overlap in SPY could potentially be looked at like an error. If this is the case, then the turquoise labeling on the chart should come to pass and we should ideally see price target the $680 - $710 area. If it is an early indicator that the SPX is all but done, it may not get another high and begin moving lower very soon.
I fall on the false signal side of things personally. I think price is destined to hit the $705-$710 price range to cap off the wave (3). However, every chart stands on their own, and the overlap cannot and should not be overlook and outright dismissed. Time will tell, but either way, I believe this larger move higher is nearing an end.
Go to ewtdaily.com for DETAILED DAILY UPDATES on 27 unique tickers and a daily zoom call with members to discuss latest analysis and get a 7-day FREE trial
Bonam Fortunam,
--Tyler
Bonam Fortunam,
--Tyler
Disclaimer
The information and publications are not meant to be, and do not constitute, financial, investment, trading, or other types of advice or recommendations supplied or endorsed by TradingView. Read more in the Terms of Use.