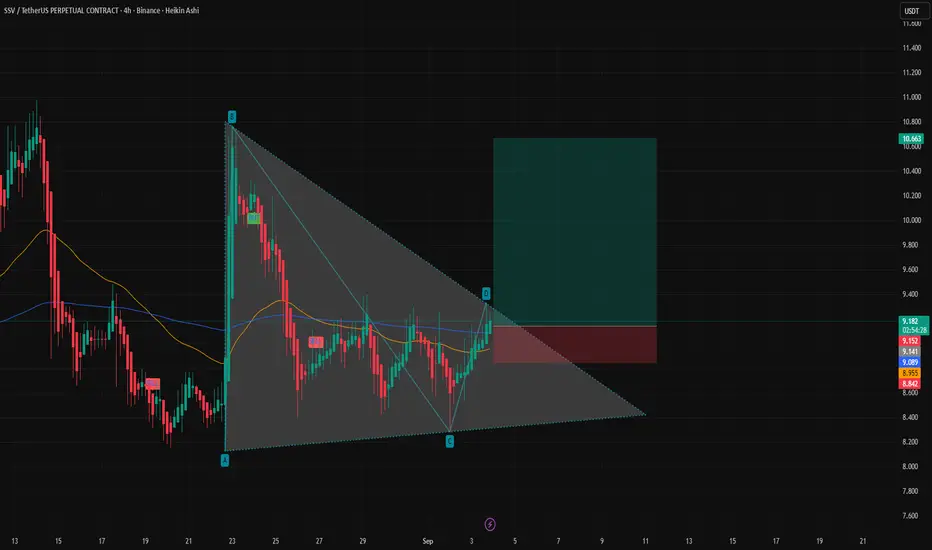
1. Pattern
The chart is showing a descending triangle / falling wedge structure (A–B–C–D).
Price has moved up strongly from point C → D, now testing the upper trendline resistance.
If breakout happens above 9.20–9.30, bullish momentum can accelerate.
2. Key Levels
Immediate Resistance: 9.20 – 9.30 (trendline + supply zone).
Next Targets:
TP1 → 9.60
TP2 → 10.20
TP3 → 11.00 (extended breakout target).
Support Levels:
9.00 (short-term EMA + round number).
8.95 (200 EMA).
8.60 (lower wedge support).
3. Indicators
EMA Structure:
Price is trading just above 50 EMA (orange) and 200 EMA (blue) → early bullish signal.
If 50 EMA crosses 200 EMA, trend confirmation will strengthen.
Momentum: Recent bullish candles show strength; watch for volume confirmation.
4. Scenarios
Bullish (High Probability):
Break and close above 9.30 → opens the way to 9.60 → 10.20 → 11.00.
Bearish (Low Probability):
If rejection occurs, price may retest 9.00 → 8.95 support, possibly even 8.60.
📌 Trading Plan
Entry (Aggressive): Current zone (9.15–9.20), anticipating breakout.
Entry (Conservative): Wait for 4H candle close above 9.30.
Stop Loss: Below 8.85 (safe zone under support).
Targets:
🎯 TP1: 9.60
🎯 TP2: 10.20
🎯 TP3: 11.00
✅ Summary:
SSV/USDT is at a decisive point near resistance. A breakout above 9.30 will likely confirm a bullish move toward 10+. Until then, caution advised with a stop below 8.85 to manage risk.
Disclaimer
The information and publications are not meant to be, and do not constitute, financial, investment, trading, or other types of advice or recommendations supplied or endorsed by TradingView. Read more in the Terms of Use.
Disclaimer
The information and publications are not meant to be, and do not constitute, financial, investment, trading, or other types of advice or recommendations supplied or endorsed by TradingView. Read more in the Terms of Use.