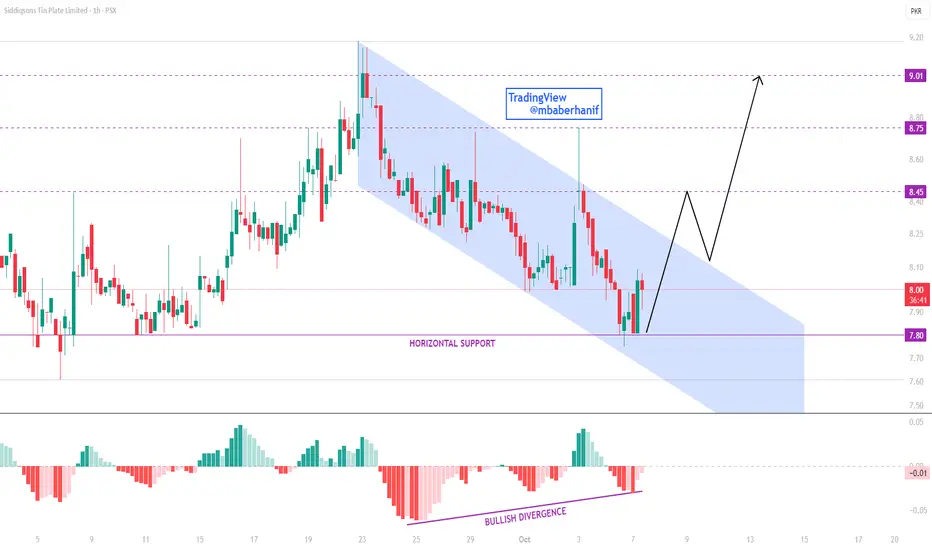
STPL is showing signs of a potential reversal as the price pulls back from the horizontal support around 7.80, simultaneously touching the lower boundary of the descending parallel channel. A bullish divergence is visible on the MACD histogram, indicating that selling momentum is weakening and buyers are likely to regain control.
If the price successfully breaks above the parallel channel, it could trigger the next bullish wave. Upside targets are set at 8.45, 8.75, and 9.01, respectively.
If the price successfully breaks above the parallel channel, it could trigger the next bullish wave. Upside targets are set at 8.45, 8.75, and 9.01, respectively.
Trade closed: target reached
Disclaimer
The information and publications are not meant to be, and do not constitute, financial, investment, trading, or other types of advice or recommendations supplied or endorsed by TradingView. Read more in the Terms of Use.
Disclaimer
The information and publications are not meant to be, and do not constitute, financial, investment, trading, or other types of advice or recommendations supplied or endorsed by TradingView. Read more in the Terms of Use.