November 15, 2025
Hey there!!
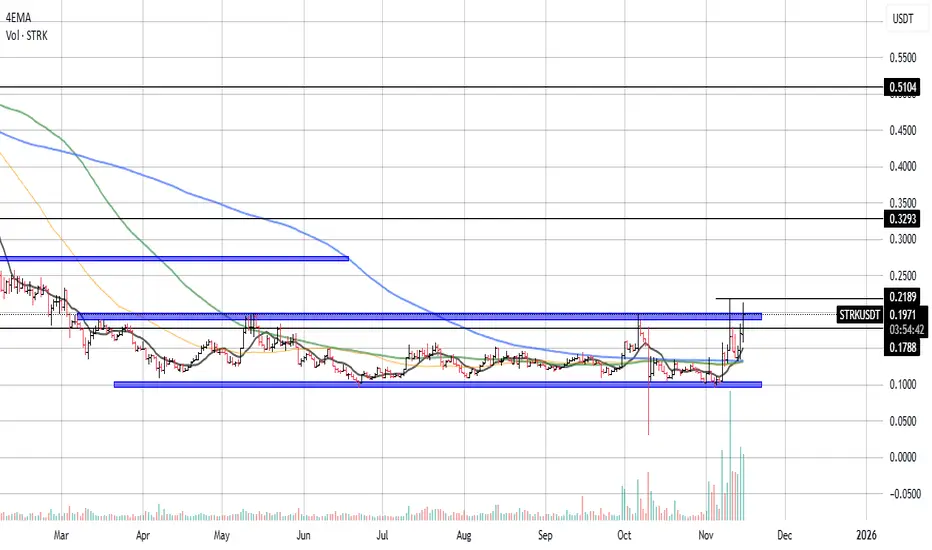
STRK has been stuck inside a very long, flat accumulation range for months, and it is now finally breaking above the key resistance zone.
This is the strongest bullish structure STRK has shown in a long time.
🔍 Technical Overview
Current price: $0.1979
4EMA cluster: $0.14 – $0.13 – $0.13
→ Price is clearly above all EMAs → momentum is shifting into bullish territory.
Volume has increased significantly during the breakout attempt → confirmation of real interest.
📊 Market Structure Breakdown
1. Multi-month accumulation (June → early November)
STRK has been building a huge base between:
Support: $0.105–0.11
Resistance: $0.17–0.18
This is a textbook compression zone where volatility dies before a proper expansion.
2. First breakout attempt (early November)
Price pushed directly into the upper box with a large spike in volume, signaling the beginning of accumulation-to-expansion transition.
3. Clean rejection wick but structure still bullish
Price wicked above the top, pulled back slightly, but:
it did not re-enter the lower accumulation,
and is holding above EMAs.
This means the breakout is still valid as long as STRK stays above $0.178–0.18.
🧱 Key Levels
Major Support Zones
$0.178 – $0.18 → extremely important
(flip zone; losing it would delay the breakout)
$0.105 – $0.11 → base of long-term accumulation
EMAs cluster ($0.13–0.14) → dynamic support if price retraces
Targets / Resistance Ahead
$0.2189 → current breakout level
$0.3293 → next major structural resistance
$0.5104 → large historical supply zone (final target of the move)
These are the same levels price respected earlier in the year.
🎯 Outlook
The chart is now in a transition from accumulation to expansion.
Bullish if:
price holds above $0.18,
and confirms above $0.2189.
If this happens, the next likely destination is $0.3293.
Bearish only if price falls back below $0.18, which would invalidate the breakout.
good trading!
Disclaimer
The information and publications are not meant to be, and do not constitute, financial, investment, trading, or other types of advice or recommendations supplied or endorsed by TradingView. Read more in the Terms of Use.
Disclaimer
The information and publications are not meant to be, and do not constitute, financial, investment, trading, or other types of advice or recommendations supplied or endorsed by TradingView. Read more in the Terms of Use.