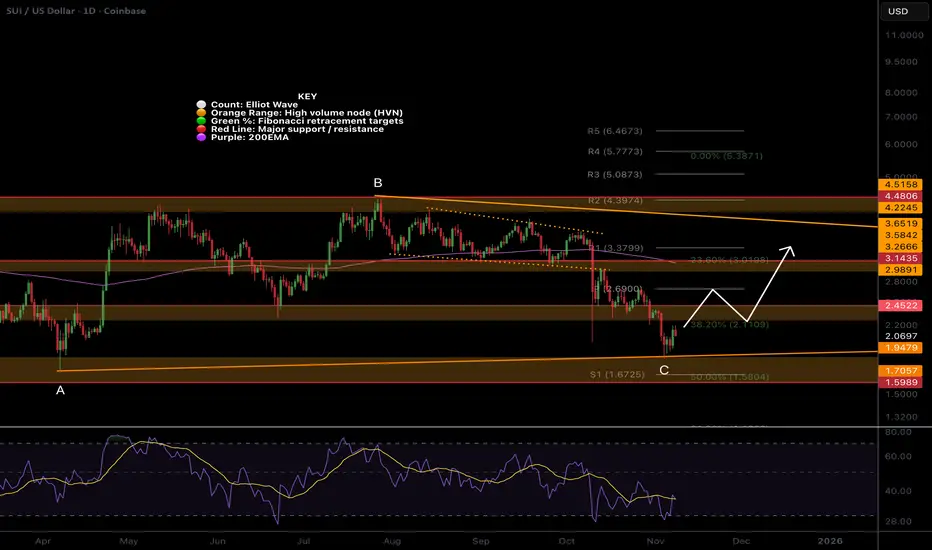
Wave C of the triangle appears complete. If this count is correct, we should accelerate to the upper boundary around $3.6 over the next month or so, with some difficulty at the daily 200EMA and pivot as resistance.
📈 Daily RSI printed bullish divergence from oversold
👉 Continued downside loses the triangle pattern, and the next target is $1.6
Safe trading
PhD Cand: Investing & Sentiment , MSc Financial Econ
Trader 8 years, Investor 15 years
The Sentiment Investor - Market Psychology: thesentimentinvestor.substack.com
Trade Planning, Strategies & Signals: Earn & Learn: tradesignals.substack.com
Trader 8 years, Investor 15 years
The Sentiment Investor - Market Psychology: thesentimentinvestor.substack.com
Trade Planning, Strategies & Signals: Earn & Learn: tradesignals.substack.com
Related publications
Disclaimer
The information and publications are not meant to be, and do not constitute, financial, investment, trading, or other types of advice or recommendations supplied or endorsed by TradingView. Read more in the Terms of Use.