SUI in weekly chartHello
I am an elliotician (at least I want to be) and as you, Elliott works with mass psychology, so when you see a chart ( mostly in large timeframes) that has neat pattern it can come from a consistent and stable psychology of this chart and its investors. (This is only my experience and conclusio
Key stats
About Sui

$SUI & the Raul Paul Effect? I thought it was strange for Raul Paul to come out and openly talk about his investement in SOL back in 2023
Usually VC's do this once they have secured their position, but Raul talked like it was God's gift to crypto and he shamelessly brought SOL up in every single talk he ever had
Now he has be

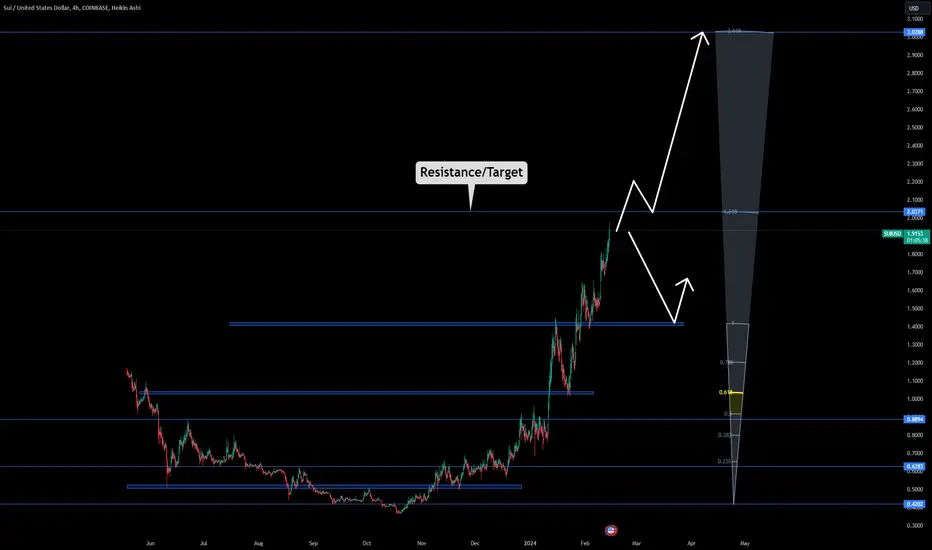
SUI confirmed bullish with Whale purchase Target: $2.14 Fib with trend guidance. Buy label not confirmed, White plot not confirmed for entry.
I've measured a pattern created by smart money called contraction.
zig zag should meet qualifications otherwise will make it somewhere near the red arc.
Candlestick trends have tendency of getting rejected once

SUI - Next Target $3.17 🤨SUI (Rank #52)
This is one that "..." would like an update on and would like to know "how to draw the vertical bar and copy and move it to measure the target price, in the case of cup and handle formation."
Firstly I always go to Fibonacci but Cup & Handle and other similar fractals are a simple

$SUIUSD is rocketing through Fib'sCOINBASE:SUIUSD could legitimately see $4 if we get another leg up to the 0.618 fib. This could be a huge rally.

SUIUSD: Bullish breakout expected.Sui is neutral on its 1D technical outlook (RSI = 55.334, MACD = 0.025, ADX = 19.421) as it remains inside a Cup pattern. The Fibonacci Channel that has been dictating the price action since October 2023, shows that this is the start of the Bullish Wave to the next HH. A similar Cup was what priced

Crazy SUI idea to $72SUI chart is very interesting and I think its possible that it will be one of the biggest gainers this bull market. My top pick is still ICP but I like SUIs chart. If we break the trend line I think the sky is the limit.
Not investment advice. Please do your DD.

$2 in sightI get the feeling when round resistances break down, the upside is more than a few cents. Sometimes people even go 'why the f not $3 or $5 then!?'.
A little pullback would be in order after consecutive green days.
Bigly hyped coin, trend is absolutely positive.
I understand Chinese New Year lasts

SUI- Great but 2.03 is Resistance🌟 Bitcoin's Breakout Surge: Professor's Big Charts Revealed 🌟
📈 Live Analysis Incoming!
Prepare for an in-depth journey through Bitcoin's latest surge as we go live on TradingView. Get ready for a session packed with insights and the unveiling of the Professor's big chart. Join us: Live Stream: www
SUI Rising Wedge At PlayBearish rising wedge pattern showing on the Daily chart for SUI. With multiple bearish divergence signaling on the RSI, I suspect a drop soon. Possibly around March this year.

See all ideas
Frequently Asked Questions
The current price of Sui (SUI) is 1.1483 USD — it has risen 0.60% in the past 24 hours. Try placing this info into the context by checking out what coins are also gaining and losing at the moment and seeing SUI price chart.
The current market capitalization of Sui (SUI) is 2.69 B USD. To see this number in a context check out our list of crypto coins ranked by their market caps or see crypto market cap charts.
Sui (SUI) trading volume in 24 hours is 275.48 M USD. See how often other coins are traded in this list.
Sui price has risen by 28.02% over the last week, its month performance shows a 16.28% decrease, and as for the last year, Sui has increased by 9.30%. See more dynamics on SUI price chart.
Keep track of coins' changes with our Crypto heatmap.
Keep track of coins' changes with our Crypto heatmap.
Sui (SUI) reached its highest price on Mar 27, 2024 — it amounted to 2.1816 USD. Find more insights on the SUI price chart.
See the list of crypto gainers and choose what best fits your strategy.
See the list of crypto gainers and choose what best fits your strategy.
Sui (SUI) reached the lowest price of 0.3630 USD on Oct 19, 2023. View more Sui dynamics on the price chart.
See the list of crypto losers to find unexpected opportunities.
See the list of crypto losers to find unexpected opportunities.
The current circulating supply of Sui (SUI) is 10.00 B USD. To get a wider picture you can check out our list of coins with the highest circulating supply, as well as the ones with the lowest number of tokens in circulation.
Sui has the limit of 10.00 B coins. No matter how the currency evolves, no new coins will be released after this number is reached.
The safest choice when buying SUI is to go to a well-known crypto exchange. Some of the popular names are Binance, Coinbase, Kraken. But you'll have to find a reliable broker and create an account first. You can trade SUI right from TradingView charts — just choose a broker and connect to your account.
Crypto markets are famous for their volatility, so one should study all the available stats before adding crypto assets to their portfolio. Very often it's technical analysis that comes in handy. We prepared technical ratings for Sui (SUI): today its technical analysis shows the neutral signal, and according to the 1 week rating SUI shows the sell signal. And you'd better dig deeper and study 1 month rating too — it's strong buy. Find inspiration in Sui trading ideas and keep track of what's moving crypto markets with our crypto news feed.
Sui (SUI) is just as reliable as any other crypto asset — this corner of the world market is highly volatile. Today, for instance, Sui is estimated as 4.23% volatile. The only thing it means is that you must prepare and examine all available information before making a decision. And if you're not sure about Sui, you can find more inspiration in our curated watchlists.
You can discuss Sui (SUI) with other users in our public chats, Minds or in the comments to Ideas.