Alright, so  SUI is the most requested coin for me to cover, let's go starting with the WEEKLY view, the DAILY, 4-hour and the HOURLY charts in next posts later on this evening.
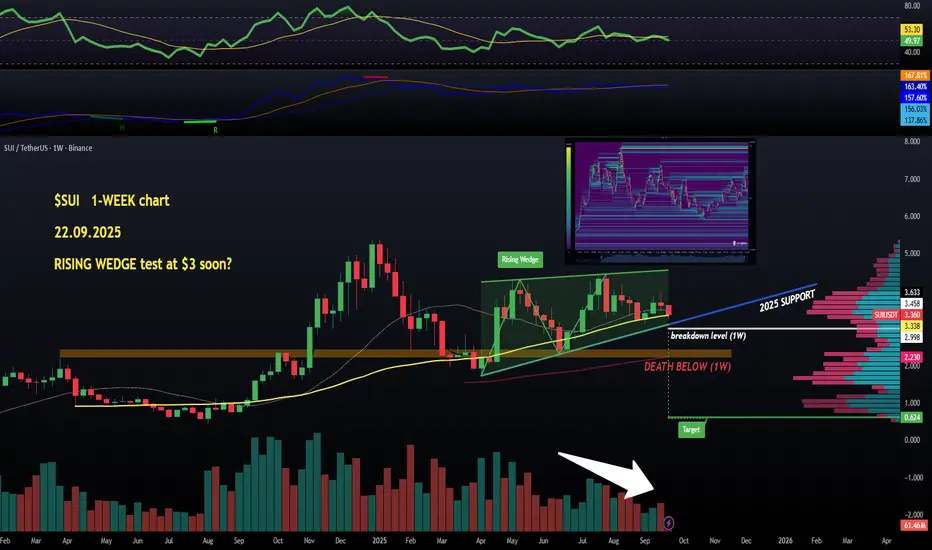
So the weekly has got one chart pattern to worry about, the 5-month-old RISING WEDGE which is basically a red flag despite making higher highs and higher low (bullish market structure intact).
#SUİ is still a touch above the yellow (50 MA) line, and key levels to watch are the $3 mark (breakdown level) and the blue rising support. We really don't want to lose any of these levels.
Actually, I will look for some shorts below $3.
Liquidity wise, not much to clear below the price, and a lot of it above the last local highs. See the attached Liquidity Map.
Next posts to continue the analysis on shorter timeframes☝️👽
Disclaimer
The information and publications are not meant to be, and do not constitute, financial, investment, trading, or other types of advice or recommendations supplied or endorsed by TradingView. Read more in the Terms of Use.
Disclaimer
The information and publications are not meant to be, and do not constitute, financial, investment, trading, or other types of advice or recommendations supplied or endorsed by TradingView. Read more in the Terms of Use.