📊 SUPERUSDT – Multi-timeframe Analysis (29/09/2025)
🔹 Realtime Tracking
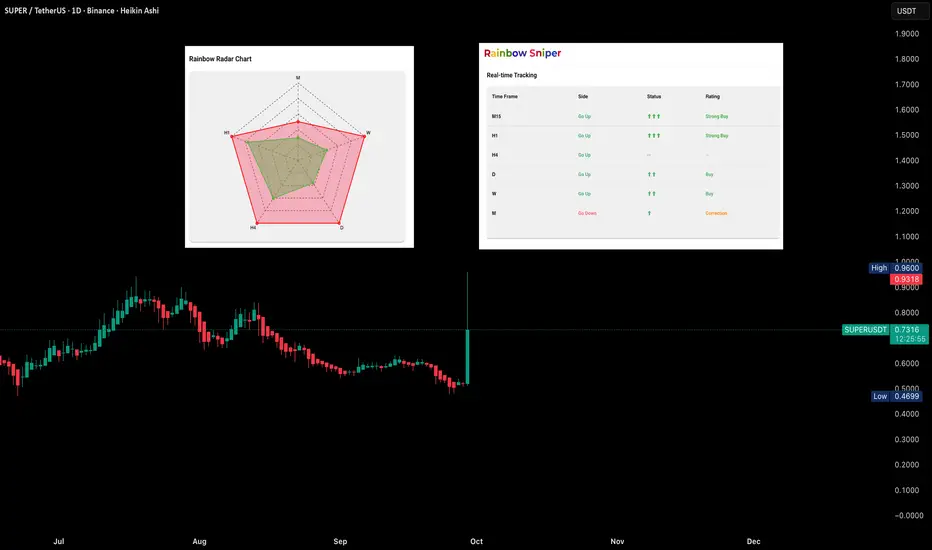
Intraday (D1–H4): Both Daily and 4H show Go Up, reflecting short-term strength.
Weekly (W–D1): Weekly and Daily remain aligned on the upside, confirming mid-term support.
Monthly (M–W): Monthly still shows Correction, while Weekly holds BUY → long-term trend is not yet fully confirmed.
🔹 Rainbow Radar Chart
Monthly: Red inside, narrow green loop → weak long-term structure, low inflows.
Weekly: Red outer layer, green wide → strong BUY momentum with visible capital flow.
Daily: BUY bias but with limited expansion → short-term trend still building up.
H4 & H1: BUY present, with H1 showing strong expansion.
👉 Overall: Strength is concentrated in the short and mid-term, while the long-term trend is still in correction.
🔹 Daily Signals
Signals: 3
Win rate: 100%
Avg return: ~22.59%
Current price: around 0.90, spiking after an extended accumulation phase.
📌 This post reflects statistical data from the dashboard and does not represent investment advice.
🔹 Realtime Tracking
Intraday (D1–H4): Both Daily and 4H show Go Up, reflecting short-term strength.
Weekly (W–D1): Weekly and Daily remain aligned on the upside, confirming mid-term support.
Monthly (M–W): Monthly still shows Correction, while Weekly holds BUY → long-term trend is not yet fully confirmed.
🔹 Rainbow Radar Chart
Monthly: Red inside, narrow green loop → weak long-term structure, low inflows.
Weekly: Red outer layer, green wide → strong BUY momentum with visible capital flow.
Daily: BUY bias but with limited expansion → short-term trend still building up.
H4 & H1: BUY present, with H1 showing strong expansion.
👉 Overall: Strength is concentrated in the short and mid-term, while the long-term trend is still in correction.
🔹 Daily Signals
Signals: 3
Win rate: 100%
Avg return: ~22.59%
Current price: around 0.90, spiking after an extended accumulation phase.
📌 This post reflects statistical data from the dashboard and does not represent investment advice.
Founder: rainbowsniper.ai (searching trend systme,coming soon) Telegram information: t.me/rainbowmg3 Vietnammese Channel: chat.beincom.com/178aa7279bd5/channels/town-square
Disclaimer
The information and publications are not meant to be, and do not constitute, financial, investment, trading, or other types of advice or recommendations supplied or endorsed by TradingView. Read more in the Terms of Use.