________________________________________
🚀 Tata Motors Ltd (NSE: TATAMOTORS) | Symmetrical Triangle Breakout Watch
________________________________________
🏢 Company Overview
Tata Motors Ltd is one of India’s leading automobile manufacturers, producing cars, SUVs, electric vehicles, and commercial vehicles. After an extended consolidation phase, the stock is trading inside a symmetrical triangle formation, indicating a possible strong directional move ahead.
________________________________________
📊 Current Market Snapshot
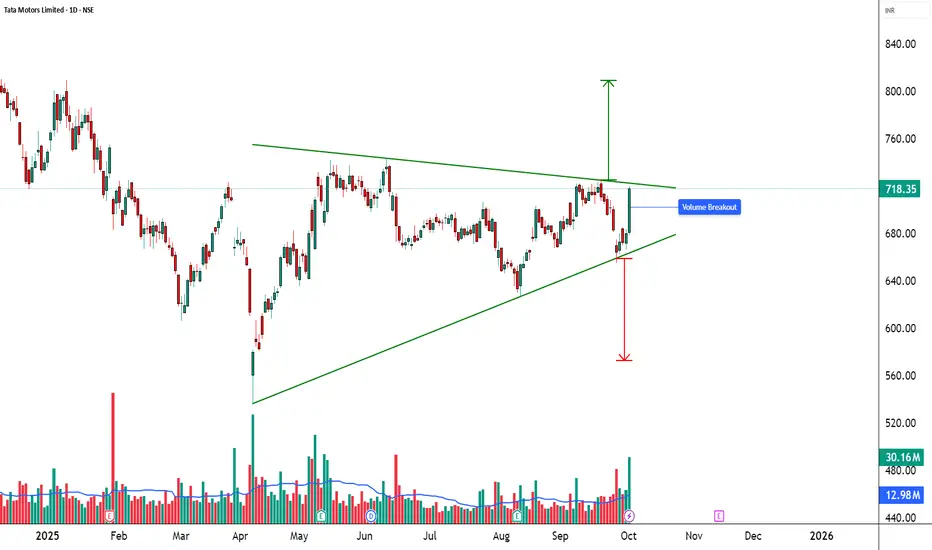
CMP: ₹718.35
Sector: Automobiles & Commercial Vehicles
Pattern Observed: 🔺 Symmetrical Triangle
Candlestick Signal: Bullish Marubozu + Strong Momentum Candle
Strength Rating: ⭐⭐⭐⭐ (Bullish Breakout Watch)
________________________________________
📈 Price Action & Chart Pattern
The stock has been consolidating within a symmetrical triangle, where buyers are defending higher lows while sellers cap gains at the resistance zone. The latest session witnessed a powerful bullish candle with extremely high volume, suggesting institutional participation.
Support Trendline: ₹665 – ₹670
Resistance Trendline: ₹720 – ₹725
Breakout Zone: Above ₹725 with strong volume
Breakdown Zone: Below ₹665 may invite fresh selling pressure
🔍 Why Important? Symmetrical triangles act as springboards for big moves once a breakout/breakdown occurs with confirmation.
________________________________________
🔎 Technical Indicators
RSI (14): 59.75 → Turning bullish with upside room.
EMA Support: Price reclaimed EMA levels, signaling renewed strength.
Volume: Recent upmove supported by 3x average volumes, a strong confirmation factor.
________________________________________
📍 Key Levels to Watch
Immediate Support: ₹665 – ₹670
Immediate Resistance: ₹720 – ₹725
Upside possible (if breakout): ₹770 – ₹800
Downside possible (if breakdown): ₹620 – ₹600
________________________________________
🔮 Bullish & Bearish Scenarios
✅ Bullish Case: A strong close above ₹725 with volume can trigger a rally towards ₹770–₹800.
⚠️ Bearish Case: Rejection at resistance and breakdown below ₹665 may drag the stock back to ₹620.
________________________________________
📝 STWP Trade Analysis
Entry: ₹718.35
Stop-loss: ₹665.75 (just below triangle support)
Risk: 52.60 points
Strength: ⚡ Strong Bullish Momentum + Extremely High Volume
Demand Zone: ₹666.65 – ₹683 | SL: 665.75
📌 Note: Strong momentum setup with excellent volume confirmation. Traders must stay disciplined with SL.
________________________________________
🎯 Final Outlook
Tata Motors is at a decisive breakout point. If the stock sustains above ₹725 with strong volumes, it could fuel a sharp rally towards ₹800. Failure to hold this zone may lead to renewed consolidation or a pullback towards ₹665. Patience and strict discipline are essential here.
________________________________________
💡 Learning Note: Symmetrical triangles with heavy-volume breakouts often lead to trend continuation setups. Combining price action, candlestick strength, and volume surge improves the accuracy of trade setups.
________________________________________
⚠️ Disclosure & Disclaimer – Please Read Carefully
The information shared here is meant purely for learning and awareness. It is not a buy or sell recommendation and should not be taken as investment advice. I am not a SEBI-registered investment adviser, and all views expressed are based on personal study, chart patterns, and publicly available market data.
Trading—whether in stocks or options—carries risk. Markets can move unexpectedly, and losses can sometimes exceed the money you have invested. Past performance or past setups do not guarantee future results.
If you are a beginner, treat this as a guide to understand how the market works and practice on paper trades before risking real money. If you are experienced, always assess your own risk, position sizing, and strategy suitability before entering trades.
Consult a SEBI-registered financial adviser before making any real trading decision. By engaging with this content, you acknowledge full responsibility for your trades and investments.
💬 Found this useful?
🔼 Give this post a Boost to help more traders discover clean, structured learning.
✍️ Drop your thoughts, questions, or setups in the comments — let’s grow together!
🔁 Share with fellow traders and beginners to spread awareness.
👉 “If you liked this breakdown, follow for more clean, structured setups with discipline at the core.”
🚀 Stay Calm. Stay Clean. Trade With Patience.
Trade Smart | Learn Zones | Be Self-Reliant 📊
________________________________________
🚀 Tata Motors Ltd (NSE: TATAMOTORS) | Symmetrical Triangle Breakout Watch
________________________________________
🏢 Company Overview
Tata Motors Ltd is one of India’s leading automobile manufacturers, producing cars, SUVs, electric vehicles, and commercial vehicles. After an extended consolidation phase, the stock is trading inside a symmetrical triangle formation, indicating a possible strong directional move ahead.
________________________________________
📊 Current Market Snapshot
CMP: ₹718.35
Sector: Automobiles & Commercial Vehicles
Pattern Observed: 🔺 Symmetrical Triangle
Candlestick Signal: Bullish Marubozu + Strong Momentum Candle
Strength Rating: ⭐⭐⭐⭐ (Bullish Breakout Watch)
________________________________________
📈 Price Action & Chart Pattern
The stock has been consolidating within a symmetrical triangle, where buyers are defending higher lows while sellers cap gains at the resistance zone. The latest session witnessed a powerful bullish candle with extremely high volume, suggesting institutional participation.
Support Trendline: ₹665 – ₹670
Resistance Trendline: ₹720 – ₹725
Breakout Zone: Above ₹725 with strong volume
Breakdown Zone: Below ₹665 may invite fresh selling pressure
🔍 Why Important? Symmetrical triangles act as springboards for big moves once a breakout/breakdown occurs with confirmation.
________________________________________
🔎 Technical Indicators
RSI (14): 59.75 → Turning bullish with upside room.
EMA Support: Price reclaimed EMA levels, signaling renewed strength.
Volume: Recent upmove supported by 3x average volumes, a strong confirmation factor.
________________________________________
📍 Key Levels to Watch
Immediate Support: ₹665 – ₹670
Immediate Resistance: ₹720 – ₹725
Upside possible (if breakout): ₹770 – ₹800
Downside possible (if breakdown): ₹620 – ₹600
________________________________________
🔮 Bullish & Bearish Scenarios
✅ Bullish Case: A strong close above ₹725 with volume can trigger a rally towards ₹770–₹800.
⚠️ Bearish Case: Rejection at resistance and breakdown below ₹665 may drag the stock back to ₹620.
________________________________________
📝 STWP Trade Analysis
Entry: ₹718.35
Stop-loss: ₹665.75 (just below triangle support)
Risk: 52.60 points
Strength: ⚡ Strong Bullish Momentum + Extremely High Volume
Demand Zone: ₹666.65 – ₹683 | SL: 665.75
📌 Note: Strong momentum setup with excellent volume confirmation. Traders must stay disciplined with SL.
________________________________________
🎯 Final Outlook
Tata Motors is at a decisive breakout point. If the stock sustains above ₹725 with strong volumes, it could fuel a sharp rally towards ₹800. Failure to hold this zone may lead to renewed consolidation or a pullback towards ₹665. Patience and strict discipline are essential here.
________________________________________
💡 Learning Note: Symmetrical triangles with heavy-volume breakouts often lead to trend continuation setups. Combining price action, candlestick strength, and volume surge improves the accuracy of trade setups.
________________________________________
⚠️ Disclosure & Disclaimer – Please Read Carefully
The information shared here is meant purely for learning and awareness. It is not a buy or sell recommendation and should not be taken as investment advice. I am not a SEBI-registered investment adviser, and all views expressed are based on personal study, chart patterns, and publicly available market data.
Trading—whether in stocks or options—carries risk. Markets can move unexpectedly, and losses can sometimes exceed the money you have invested. Past performance or past setups do not guarantee future results.
If you are a beginner, treat this as a guide to understand how the market works and practice on paper trades before risking real money. If you are experienced, always assess your own risk, position sizing, and strategy suitability before entering trades.
Consult a SEBI-registered financial adviser before making any real trading decision. By engaging with this content, you acknowledge full responsibility for your trades and investments.
💬 Found this useful?
🔼 Give this post a Boost to help more traders discover clean, structured learning.
✍️ Drop your thoughts, questions, or setups in the comments — let’s grow together!
🔁 Share with fellow traders and beginners to spread awareness.
👉 “If you liked this breakdown, follow for more clean, structured setups with discipline at the core.”
🚀 Stay Calm. Stay Clean. Trade With Patience.
Trade Smart | Learn Zones | Be Self-Reliant 📊
________________________________________
📊 STWP | Mentor | Demand & Supply Specialist
🎯 Helping you become a self-reliant & independent trader
🎓 Learn more: simpletradewithpatience.com
📲 WhatsApp: wa.me/919987567889
🔍 Trade with Clarity. Learn with Patience.
🎯 Helping you become a self-reliant & independent trader
🎓 Learn more: simpletradewithpatience.com
📲 WhatsApp: wa.me/919987567889
🔍 Trade with Clarity. Learn with Patience.
Disclaimer
The information and publications are not meant to be, and do not constitute, financial, investment, trading, or other types of advice or recommendations supplied or endorsed by TradingView. Read more in the Terms of Use.