Key Technical Levels for the 1-Week Timeframe:
Immediate Support: ₹383.25 to ₹383.80
Next Support Level: ₹370.00
Immediate Resistance: ₹386.39
Next Resistance Level: ₹391.47
If the stock breaks below ₹383.25, it may test ₹370.00. Conversely, a rise above ₹391.47 could indicate a potential reversal.
Technical Indicators:
Relative Strength Index (RSI): Approximately 30.5, nearing oversold territory.
Moving Average Convergence Divergence (MACD): Currently at -2.66, indicating bearish momentum.
Moving Averages: The 5-day moving average is ₹384.54, suggesting short-term bearishness.
Fundamental insights:
Intrinsic Value: Estimated at ₹211.62, suggesting the stock is currently overvalued.
Profitability: The company reported a 6% year-on-year increase in Q1 net profit to ₹1,262 crore, driven by stronger revenues from renewable energy and transmission & distribution segments.
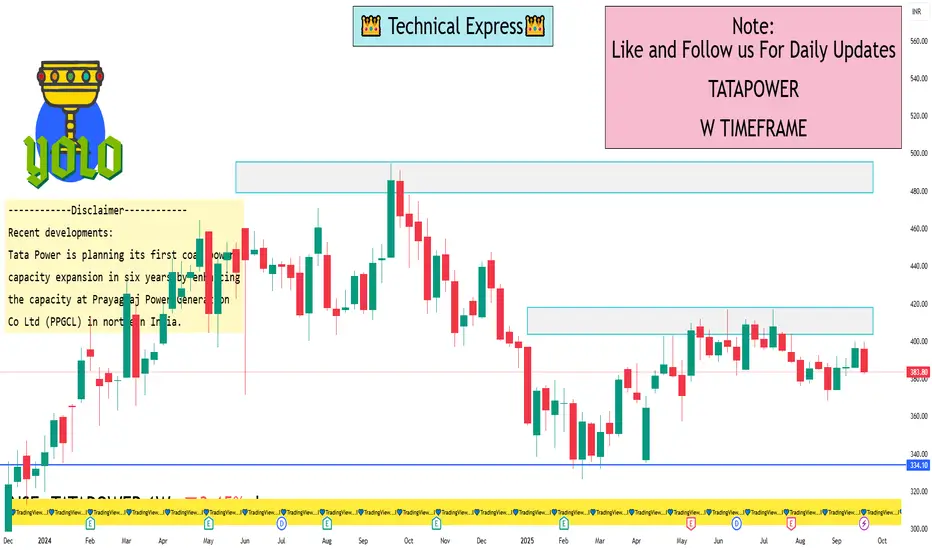
Recent developments:
Tata Power is planning its first coal power capacity expansion in six years by enhancing the capacity at Prayagraj Power Generation Co Ltd (PPGCL) in northern India.
Outlook:
The stock is currently in a downtrend, with technical indicators favoring a bearish scenario. Investors should monitor support levels closely and consider waiting for a confirmed reversal before making any investment decisions.
Immediate Support: ₹383.25 to ₹383.80
Next Support Level: ₹370.00
Immediate Resistance: ₹386.39
Next Resistance Level: ₹391.47
If the stock breaks below ₹383.25, it may test ₹370.00. Conversely, a rise above ₹391.47 could indicate a potential reversal.
Technical Indicators:
Relative Strength Index (RSI): Approximately 30.5, nearing oversold territory.
Moving Average Convergence Divergence (MACD): Currently at -2.66, indicating bearish momentum.
Moving Averages: The 5-day moving average is ₹384.54, suggesting short-term bearishness.
Fundamental insights:
Intrinsic Value: Estimated at ₹211.62, suggesting the stock is currently overvalued.
Profitability: The company reported a 6% year-on-year increase in Q1 net profit to ₹1,262 crore, driven by stronger revenues from renewable energy and transmission & distribution segments.
Recent developments:
Tata Power is planning its first coal power capacity expansion in six years by enhancing the capacity at Prayagraj Power Generation Co Ltd (PPGCL) in northern India.
Outlook:
The stock is currently in a downtrend, with technical indicators favoring a bearish scenario. Investors should monitor support levels closely and consider waiting for a confirmed reversal before making any investment decisions.
I built a Buy & Sell Signal Indicator with 85% accuracy.
📈 Get access via DM or
WhatsApp: wa.link/d997q0
Contact - +91 76782 40962
| Email: techncialexpress@gmail.com
| Script Coder | Trader | Investor | From India
📈 Get access via DM or
WhatsApp: wa.link/d997q0
Contact - +91 76782 40962
| Email: techncialexpress@gmail.com
| Script Coder | Trader | Investor | From India
Related publications
Disclaimer
The information and publications are not meant to be, and do not constitute, financial, investment, trading, or other types of advice or recommendations supplied or endorsed by TradingView. Read more in the Terms of Use.