🔹 Wave Structure Overview
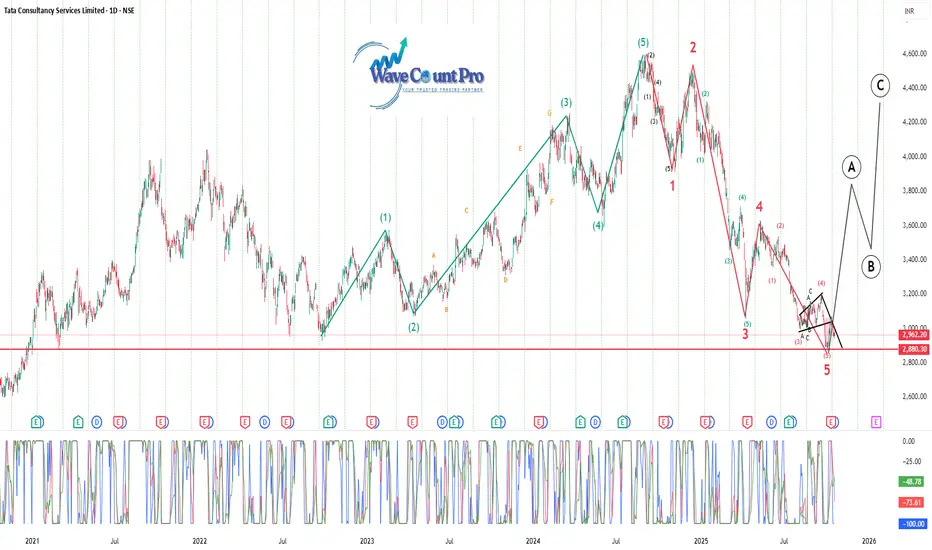
The chart clearly maps a complete 5-wave impulse uptrend (green count) followed by a 5-wave corrective decline (red count).
The current position indicates that Wave 5 of the corrective phase has just completed — signaling a possible end of the downtrend and setup for a bullish reversal.
🔹 Key Observations
Support Zone:
Strong horizontal support lies between ₹2,880–₹2,950, previously tested multiple times since 2021.
Price is currently hovering at this zone, showing signs of consolidation and potential reversal.
Wave Count Analysis:
The correction from the top (~₹4,600) unfolded in a clear 5-wave structure (1–2–3–4–5).
Subwave (5) appears to have terminated near the major support — a typical ending point for an Elliott Wave correction.
Pattern Recognition:
A falling wedge structure can be observed near the Wave 5 termination, which often precedes a bullish breakout.
The oscillator at the bottom also indicates oversold levels, reinforcing the likelihood of a rebound.
🔹 Projected Path (Next Phase)
The chart projects a corrective rally (A–B–C) following the completed 5-wave decline:
Wave A: Initial sharp rebound possibly toward ₹3,600–₹3,700.
Wave B: Pullback to retest lower supports near ₹3,200–₹3,300.
Wave C: Final leg up toward ₹4,200–₹4,400 range.
This A–B–C pattern would represent a corrective recovery phase before the next larger structure develops.
🔹 Sentiment & Outlook
Aspect View
Current Trend Bearish cycle likely completed
Immediate Bias Bullish rebound expected
Support Zone ₹2,880–₹2,950
Upside Targets ₹3,700 (A), ₹4,400 (C)
Invalidation Level Breakdown below ₹2,880
Momentum Oversold, positive divergence forming
🔹 Conclusion
TCS appears to have completed a major correction and is positioned for a medium-term trend reversal.
Holding above ₹2,880 will confirm strength, potentially leading to an A–B–C recovery toward ₹4,400 levels.
Momentum indicators and wave structure both support the beginning of a bullish phase after a prolonged decline.
Technical Analyst BY Passion
Disclaimer
The information and publications are not meant to be, and do not constitute, financial, investment, trading, or other types of advice or recommendations supplied or endorsed by TradingView. Read more in the Terms of Use.
Technical Analyst BY Passion
Disclaimer
The information and publications are not meant to be, and do not constitute, financial, investment, trading, or other types of advice or recommendations supplied or endorsed by TradingView. Read more in the Terms of Use.