📊 TCS – Technical & Educational Snapshot
Ticker: NSE:TCS | Sector: 💻 IT Services
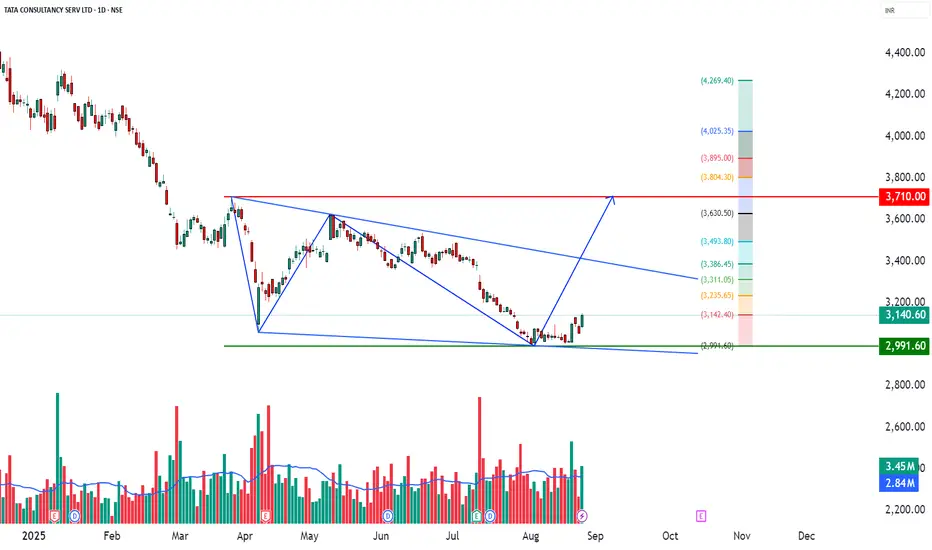
CMP: ₹3,140.60 ▲ (+2.84% | 26 Aug 2025)
Learning Bias (for study purpose): ⭐⭐⭐ (Cautiously Bullish)
Pattern Observed: 📈 Support Bounce with Volume Confirmation
📰 Sentiment Analysis
👉 Overall Sentiment: Moderately Positive ✅
Bullish Drivers:
• Bounce from strong support near ₹3,000 with bullish candle & above-avg volume
• RSI breakout + Bollinger Band expansion → fresh buying interest
• Publicly available analyst reports indicate average estimates around ₹3,725; strong bullish case highlighted up to ₹4,610
• IT sector optimism for H2 FY26 earnings recovery
Risks (Bearish Case):
• Broader trend still marked Downtrend ⚠️
• Stochastic at 92 → overbought in short-term
• Employee layoffs & union protests (~12K–30K) may dampen sentiment
• Failure to hold ₹3,047 (support) could trigger deeper correction
Short-term Outlook: Upside momentum possible towards ₹3,160–3,200, but resistance supply zone must be watched.
Long-term Outlook: Positive — strong fundamentals, debt-free balance sheet, consistent dividends, and sector recovery cues.
📊 Technical Snapshot
TCS has formed a support bounce near the ₹3,000 bottom range, supported by a strong bullish candle and above-average volume.
Indicators: MACD bullish on daily/weekly, neutral-to-bearish on monthly.
RSI ~54 → healthy momentum without being overheated.
Trend direction still tagged as Downtrend, hence positional caution is advised.
📊 Volume Check
🔹 Current Volume: 3.45M
🔹 20 SMA Volume: 2.84M ✅
💥 Above-average participation → validates breakout reliability.
💡 Interpretation: Stronger demand from institutions/traders supporting price action.
💡 Learnings
Support bounces near psychological zones (₹3,000 in this case) often attract buying interest.
When combined with RSI breakouts, Bollinger Band expansion, and volume confirmation, the setup becomes more reliable.
However, overbought stochastic warns of possible near-term pullbacks — hence, stop-loss discipline is key.
📌 Key Levels
Resistance: 3,169 | 3,198 | 3,244
Support: 3,094 | 3,048 | 3,019
Fibonacci Reference Levels: 2,991 | 3,142 | 3,235 | 3,311 | 3,386 | 3,494 | 3,631
🎯 STWP Learning Reference
• Observed bounce zone: ~₹3,152
• Key support level: ~₹3,047
• Upside reference zones (if momentum continues): 3,200 | 3,244 | 3,310
• Pullback watch zone: 3,048–3,095
• Invalidation reference: Below 2,991 → momentum weakens
⚠️ Disclaimer – Please Read Carefully
This post is shared only for educational and informational purposes. It is not investment advice or a recommendation to buy/sell any security. I am not a SEBI-registered investment advisor. Please do your own research or consult a SEBI-registered advisor before making trading or investment decisions.
Trading and investing involve risk. Past performance or past setups do not guarantee future results. Always use stop-loss, proper position sizing, and risk management.
💬 Found this useful?
🔼 Boost this post to help more traders discover clean setups.
✍️ Share your thoughts, setups, or questions in the comments — let’s learn together.
🔁 Repost to spread awareness among traders & beginners.
✅ Follow simpletradewithpatience for clean charts, price action insights & beginner-friendly setups.
🚀 Stay Calm. Stay Clean. Trade With Patience.
Trade Smart | Learn Zones | Be Self-Reliant 📊
Ticker: NSE:TCS | Sector: 💻 IT Services
CMP: ₹3,140.60 ▲ (+2.84% | 26 Aug 2025)
Learning Bias (for study purpose): ⭐⭐⭐ (Cautiously Bullish)
Pattern Observed: 📈 Support Bounce with Volume Confirmation
📰 Sentiment Analysis
👉 Overall Sentiment: Moderately Positive ✅
Bullish Drivers:
• Bounce from strong support near ₹3,000 with bullish candle & above-avg volume
• RSI breakout + Bollinger Band expansion → fresh buying interest
• Publicly available analyst reports indicate average estimates around ₹3,725; strong bullish case highlighted up to ₹4,610
• IT sector optimism for H2 FY26 earnings recovery
Risks (Bearish Case):
• Broader trend still marked Downtrend ⚠️
• Stochastic at 92 → overbought in short-term
• Employee layoffs & union protests (~12K–30K) may dampen sentiment
• Failure to hold ₹3,047 (support) could trigger deeper correction
Short-term Outlook: Upside momentum possible towards ₹3,160–3,200, but resistance supply zone must be watched.
Long-term Outlook: Positive — strong fundamentals, debt-free balance sheet, consistent dividends, and sector recovery cues.
📊 Technical Snapshot
TCS has formed a support bounce near the ₹3,000 bottom range, supported by a strong bullish candle and above-average volume.
Indicators: MACD bullish on daily/weekly, neutral-to-bearish on monthly.
RSI ~54 → healthy momentum without being overheated.
Trend direction still tagged as Downtrend, hence positional caution is advised.
📊 Volume Check
🔹 Current Volume: 3.45M
🔹 20 SMA Volume: 2.84M ✅
💥 Above-average participation → validates breakout reliability.
💡 Interpretation: Stronger demand from institutions/traders supporting price action.
💡 Learnings
Support bounces near psychological zones (₹3,000 in this case) often attract buying interest.
When combined with RSI breakouts, Bollinger Band expansion, and volume confirmation, the setup becomes more reliable.
However, overbought stochastic warns of possible near-term pullbacks — hence, stop-loss discipline is key.
📌 Key Levels
Resistance: 3,169 | 3,198 | 3,244
Support: 3,094 | 3,048 | 3,019
Fibonacci Reference Levels: 2,991 | 3,142 | 3,235 | 3,311 | 3,386 | 3,494 | 3,631
🎯 STWP Learning Reference
• Observed bounce zone: ~₹3,152
• Key support level: ~₹3,047
• Upside reference zones (if momentum continues): 3,200 | 3,244 | 3,310
• Pullback watch zone: 3,048–3,095
• Invalidation reference: Below 2,991 → momentum weakens
⚠️ Disclaimer – Please Read Carefully
This post is shared only for educational and informational purposes. It is not investment advice or a recommendation to buy/sell any security. I am not a SEBI-registered investment advisor. Please do your own research or consult a SEBI-registered advisor before making trading or investment decisions.
Trading and investing involve risk. Past performance or past setups do not guarantee future results. Always use stop-loss, proper position sizing, and risk management.
💬 Found this useful?
🔼 Boost this post to help more traders discover clean setups.
✍️ Share your thoughts, setups, or questions in the comments — let’s learn together.
🔁 Repost to spread awareness among traders & beginners.
✅ Follow simpletradewithpatience for clean charts, price action insights & beginner-friendly setups.
🚀 Stay Calm. Stay Clean. Trade With Patience.
Trade Smart | Learn Zones | Be Self-Reliant 📊
📊 STWP | Mentor | Demand & Supply Specialist
🎯 Helping you become a self-reliant & independent trader
🎓 Learn more: simpletradewithpatience.com
📲 WhatsApp: wa.me/919987567889
🔍 Trade with Clarity. Learn with Patience.
🎯 Helping you become a self-reliant & independent trader
🎓 Learn more: simpletradewithpatience.com
📲 WhatsApp: wa.me/919987567889
🔍 Trade with Clarity. Learn with Patience.
Disclaimer
The information and publications are not meant to be, and do not constitute, financial, investment, trading, or other types of advice or recommendations supplied or endorsed by TradingView. Read more in the Terms of Use.