Trading Idea
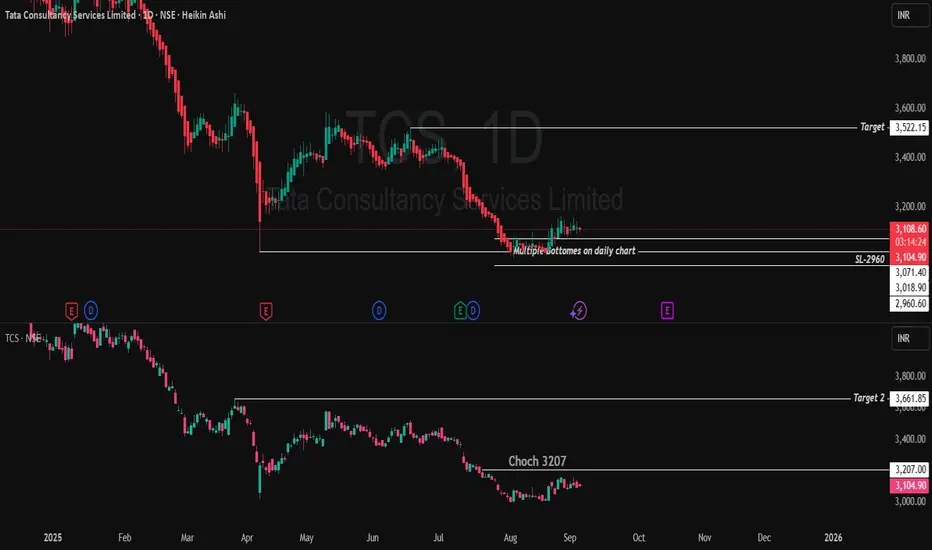
- Entry: On retracement or sustain above 3114, ideally scale in near 3070–3114 if retest occurs.
- Trigger Level: Add or pyramid position above 3207 for further momentum.
- Target Zones: 3295 (initial), 3661 (extended)
Key Point to be keep in mind before trade: - Doji candle after long bearish trend signals potential reversal
- 18-day consolidation between 3070–3015 formed a strong base
- Breakout occurred above 3072 in last 6 days, confirming momentum shift
- Current price around 3114 supports bullish trend continuation
- Near-term change of character (CHoCH) expected at 3207; clears key resistance
- Targets after CHoCH: 3295 (first), then 3661 (extended)
- Suggested entry: buy on dips near 3070–3114 or on breakout above 3207
- Stop loss: below 3070 to manage risk
Heikin Ashi Doji after bearish trend and consolidation, followed by breakout at 3072 and price holding above 3114, validates bullish momentum for targets at 3295 and 3661 if 3207 is cleared with volume.Based on the Heikin Ashi daily chart for TCS, with a doji after a long bearish trend and consolidation between 3070–3015 for the last 18 days, a breakout above 3072 seen in the previous six days, and current price at 3114: - Entry: Consider buying on dips above the 3072 breakout or if price sustains above 3114, confirming momentum after the doji and consolidation.
- First Trigger: Watch for price action near 3207 (marked CHoCH); clearing this adds conviction to the uptrend.
- Targets: Initial target at 3295, with a higher target at 3661 as shown for extended bullish move.
- Stop-loss: Below the consolidation low at 3015, or more tightly just under 3070 depending on risk appetite.
This projection aligns with typical Heikin Ashi reversal logic, highlighting developing bullish strength if key resistance levels are cleared and maintained.
Disclaimer:lnkd.in/gJJDnvn2
Disclaimer
The information and publications are not meant to be, and do not constitute, financial, investment, trading, or other types of advice or recommendations supplied or endorsed by TradingView. Read more in the Terms of Use.
Disclaimer
The information and publications are not meant to be, and do not constitute, financial, investment, trading, or other types of advice or recommendations supplied or endorsed by TradingView. Read more in the Terms of Use.