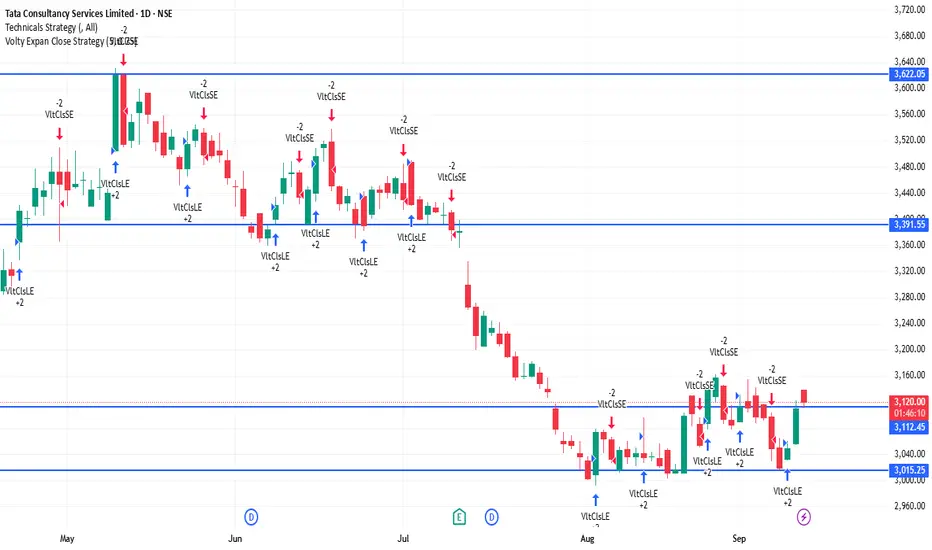
Price Action (Daily Chart)
Current price is around ₹3,117 - ₹3,120
Price is consolidating near support zones after a recent upward move.
Candle structure shows buying interest at lower levels, but resistance is capping the upside.
📊 Indicators
Moving Averages (MA):
Short-term MAs (5-day, 10-day) are slightly mixed.
Medium to long MAs (20, 50, 100, 200-day) are in buy zone, showing broader uptrend strength.
RSI (14-day): ~62-65 → indicates mild bullish momentum, not yet in overbought zone.
MACD: Shows positive crossover, momentum favors bulls but losing some strength.
⚖️ Key Levels
Immediate Resistance: ₹3,135 – ₹3,140
Next Resistance: ₹3,170 – ₹3,200
Immediate Support: ₹3,100 – ₹3,110
Strong Support: ₹3,050 – ₹3,000
📈 Outlook
Short-term sentiment: Neutral to slightly bullish as long as price holds above ₹3,100.
A breakout above ₹3,140 may open room toward ₹3,170–₹3,200.
A breakdown below ₹3,100 may drag price to ₹3,050–₹3,000.
Overall trend on daily timeframe is still uptrend, but near resistance, so caution is needed.
Related publications
Disclaimer
The information and publications are not meant to be, and do not constitute, financial, investment, trading, or other types of advice or recommendations supplied or endorsed by TradingView. Read more in the Terms of Use.
Related publications
Disclaimer
The information and publications are not meant to be, and do not constitute, financial, investment, trading, or other types of advice or recommendations supplied or endorsed by TradingView. Read more in the Terms of Use.