TLT is once again testing a major demand zone. Fundamentally, the market is approaching a rate-cut cycle, and technically the support is strong and validated by volume profiles. The probability of a bounce is higher than the risk of a breakdown.
---
Fundamental Context
We’re at a point where macro and technicals finally align:
The Federal Reserve is shifting toward easing — the rate-cut cycle has effectively begun.
Powell’s era is nearing its end, and political momentum is moving toward policies that are more supportive of debt markets.
A Trump + Bessent administration is unlikely to let Treasuries collapse; historically their fiscal stance expands borrowing and supports bond prices.
Kevin Hassett is already stepping in — an economist aligned with Trump’s economic playbook, signaling a softer policy direction.
Japan raised its rates for the first time since 2007 — a rare event that applied pressure, but the market has already priced in much of it.
Meanwhile, coupons continue to roll in, and the AI bubble keeps inflating.
When profit expectations inevitably reset, capital tends to rotate back into bonds.
👉 Altogether, this creates a bullish fundamental backdrop, and such TLT entry prices may not appear again for years.
---
Technical Picture
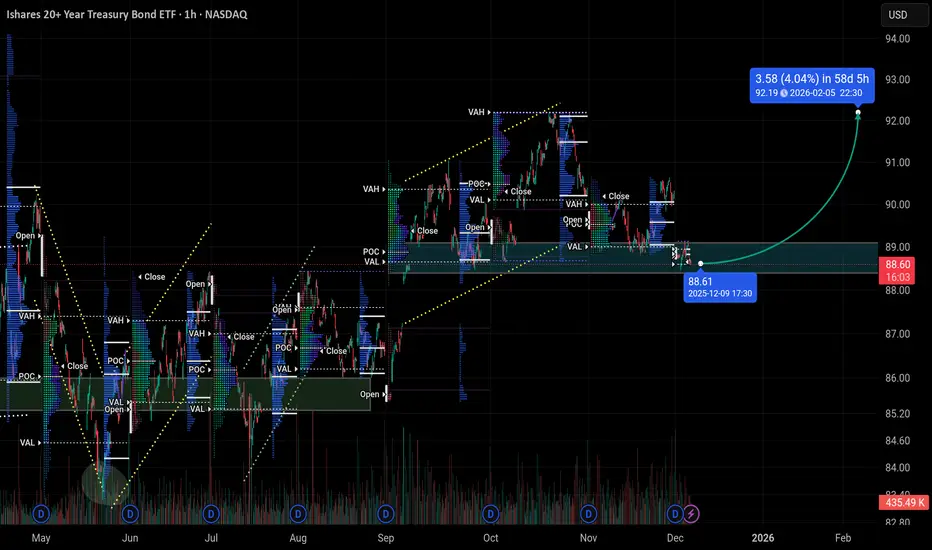
1. Key demand zone holding again
The green zone has triggered major reversals several times (May–June, August).
We’re back inside the same area, and the market is reacting.
2. Local uptrend remains intact
The yellow dotted structure has not been broken — the bullish setup stays valid.
3. TPO / Volume Profile strengthens the case
As shown on the second chart:
Previous POC and VAL levels cluster directly in this zone.
Below current prices the profile is “thin” — no heavy volume nodes → limited downside potential.
The current test aligns with VAL — a classic location where institutional buyers step in.
4. Price trajectory scenario
A move from ~88.7 back toward 92 is a natural mid-range recovery.
A +3.9% target within 1–2 months is realistic and conservative.
---
Scenario Analysis
Bullish scenario — 65%
Support holds → reversal → move toward 92.
Bearish scenario — 35%
Breakdown through the zone, but with limited follow-through due to macro and volume structure.
---
Conclusion
We are sitting right at a historically reliable support level.
The macro environment is shifting toward lower rates, technical support is clean, and volume profile confirms strong demand.
This is the type of entry that, in hindsight, people call “the opportunity you only recognize later.”
---
Fundamental Context
We’re at a point where macro and technicals finally align:
The Federal Reserve is shifting toward easing — the rate-cut cycle has effectively begun.
Powell’s era is nearing its end, and political momentum is moving toward policies that are more supportive of debt markets.
A Trump + Bessent administration is unlikely to let Treasuries collapse; historically their fiscal stance expands borrowing and supports bond prices.
Kevin Hassett is already stepping in — an economist aligned with Trump’s economic playbook, signaling a softer policy direction.
Japan raised its rates for the first time since 2007 — a rare event that applied pressure, but the market has already priced in much of it.
Meanwhile, coupons continue to roll in, and the AI bubble keeps inflating.
When profit expectations inevitably reset, capital tends to rotate back into bonds.
👉 Altogether, this creates a bullish fundamental backdrop, and such TLT entry prices may not appear again for years.
---
Technical Picture
1. Key demand zone holding again
The green zone has triggered major reversals several times (May–June, August).
We’re back inside the same area, and the market is reacting.
2. Local uptrend remains intact
The yellow dotted structure has not been broken — the bullish setup stays valid.
3. TPO / Volume Profile strengthens the case
As shown on the second chart:
Previous POC and VAL levels cluster directly in this zone.
Below current prices the profile is “thin” — no heavy volume nodes → limited downside potential.
The current test aligns with VAL — a classic location where institutional buyers step in.
4. Price trajectory scenario
A move from ~88.7 back toward 92 is a natural mid-range recovery.
A +3.9% target within 1–2 months is realistic and conservative.
---
Scenario Analysis
Bullish scenario — 65%
Support holds → reversal → move toward 92.
Bearish scenario — 35%
Breakdown through the zone, but with limited follow-through due to macro and volume structure.
---
Conclusion
We are sitting right at a historically reliable support level.
The macro environment is shifting toward lower rates, technical support is clean, and volume profile confirms strong demand.
This is the type of entry that, in hindsight, people call “the opportunity you only recognize later.”
Disclaimer
The information and publications are not meant to be, and do not constitute, financial, investment, trading, or other types of advice or recommendations supplied or endorsed by TradingView. Read more in the Terms of Use.
Disclaimer
The information and publications are not meant to be, and do not constitute, financial, investment, trading, or other types of advice or recommendations supplied or endorsed by TradingView. Read more in the Terms of Use.