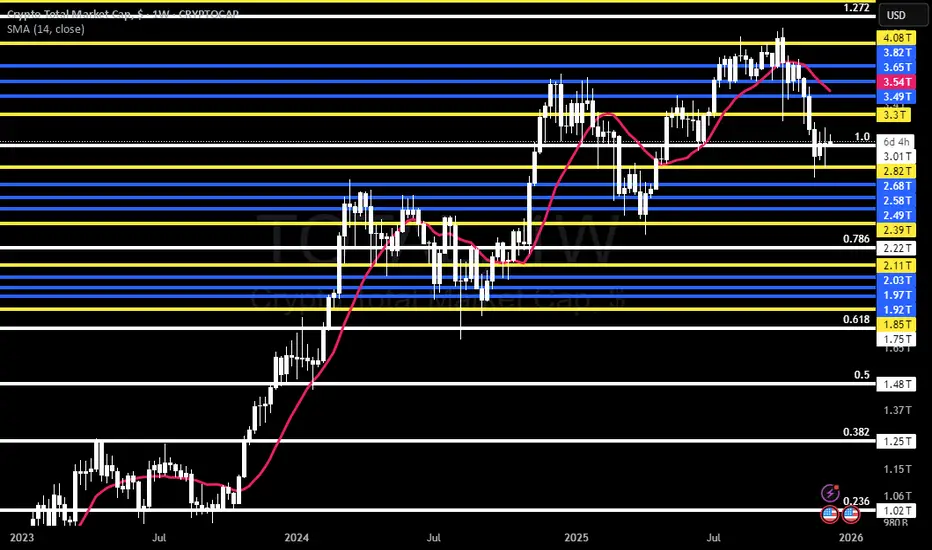
The week of Monday 21st November 2022, following a descent from its all-time high of £3.01 trillion, the total crypto market cap registered a low of £727.58 billion.
On the week of Monday 27th March 2023, the 14-week Simple Moving Average (SMA) crossed above £1.02 trillion.
On Monday 11th December 2023, the SMA crossed £1.25 trillion.
On Monday 22nd January 2024, it crossed above £1.48 trillion.
On Monday 4th March 2024, it continued upward and crossed £1.75 trillion.
By Monday 22nd April 2024, the SMA crossed £2.22 trillion.
It reached a local peak at £2.39 trillion and began turning downward on Monday 3rd June 2024, crossing back down through £2.22 trillion as it declined.
On Monday 19th August 2024, it touched £2.11 trillion and began to turn back up, starting its upward curve on Monday 21st October 2024.
It crossed back above £2.22 trillion on Monday 11th November 2024.
The rise continued, and on Monday 6th January 2025, the SMA crossed above £3.01 trillion.
On Monday 17th February 2025, it reached a local high at £3.3 trillion, and began to turn downward, crossing £3.01 trillion again on Monday 31st March 2025.
The SMA completed its downward move and began turning upward again on Monday 5th May 2025, and on Monday 23rd June 2025, it crossed above £3.01 trillion once more.
On Monday 14th July 2025, the SMA crossed £3.33 trillion,
then £3.49 trillion on Monday 11th August,
and £3.65 trillion on Monday 1st September.
It reached a new local high at £3.82 trillion on Monday 20th October 2025, before turning down again and crossing below £3.65 trillion on Monday 24th November 2025.
Disclaimer
The information and publications are not meant to be, and do not constitute, financial, investment, trading, or other types of advice or recommendations supplied or endorsed by TradingView. Read more in the Terms of Use.
Disclaimer
The information and publications are not meant to be, and do not constitute, financial, investment, trading, or other types of advice or recommendations supplied or endorsed by TradingView. Read more in the Terms of Use.