📊 What Are Bollinger Bands?
Bollinger Bands are a popular technical analysis tool developed by John Bollinger. They help traders identify volatility and potential price movements in the stock, crypto, or forex markets. 📈📉
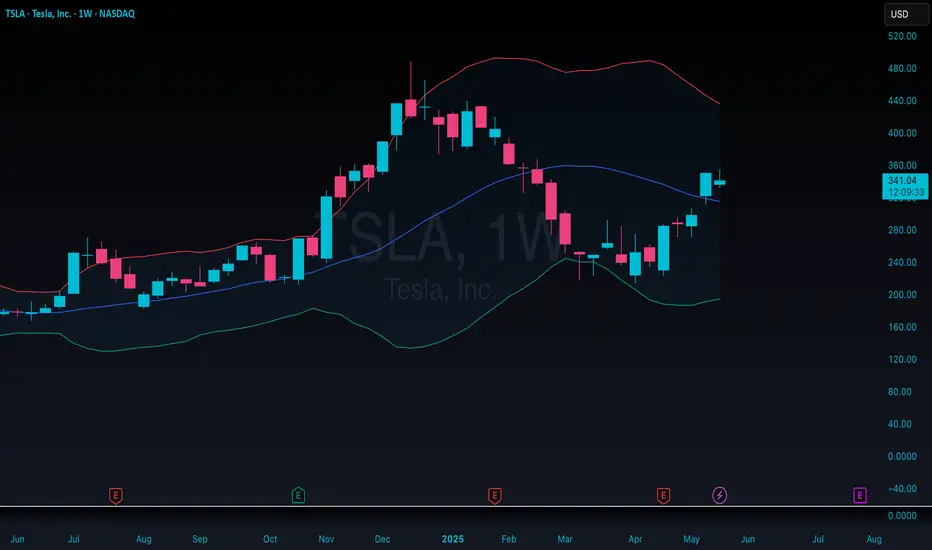
They consist of three lines:
🔹 Middle Band: A simple moving average (SMA), usually over 20 periods.
🔼 Upper Band: SMA + 2 standard deviations.
🔽 Lower Band: SMA - 2 standard deviations.
🛠️ How Do Bollinger Bands Work?
The bands expand and contract based on market volatility:
📈 When the market is volatile, the bands widen.
📉 When the market is calm, the bands narrow.
This tells traders whether the price is likely to break out or revert to the mean.
📌 How Are They Used?
✅ 1. Identifying Overbought/Oversold Conditions
If the price touches or goes above the upper band 🔼, it may be overbought (potential to sell).
If the price hits or goes below the lower band 🔽, it may be oversold (potential to buy).
🔁 2. Mean Reversion Strategy
Prices often return to the middle band (SMA) ➡️ after touching either the upper or lower band.
This is called a reversion to the mean strategy.
💥 3. Breakout Signals
Bollinger Band Squeeze: When the bands contract tightly, it usually signals a big move coming soon — but it doesn't say in which direction.
Traders look for breakouts after the squeeze to catch a new trend.
⚠️ Pro Tips
❌ Don't use Bollinger Bands alone — combine them with other indicators like RSI or MACD for better accuracy.
⏱️ Timeframe matters! They behave differently on a 5-minute chart than a daily chart.
📚 Practice in a demo account before using real money.
🧠 In Summary
Bollinger Bands help you:
Spot trends 🧭
Identify volatility 🌪️
Time entries & exits 📅
They're a powerful ally in any trader’s toolbox — just remember: no indicator is 100% accurate! 🎯
Bollinger Bands are a popular technical analysis tool developed by John Bollinger. They help traders identify volatility and potential price movements in the stock, crypto, or forex markets. 📈📉
They consist of three lines:
🔹 Middle Band: A simple moving average (SMA), usually over 20 periods.
🔼 Upper Band: SMA + 2 standard deviations.
🔽 Lower Band: SMA - 2 standard deviations.
🛠️ How Do Bollinger Bands Work?
The bands expand and contract based on market volatility:
📈 When the market is volatile, the bands widen.
📉 When the market is calm, the bands narrow.
This tells traders whether the price is likely to break out or revert to the mean.
📌 How Are They Used?
✅ 1. Identifying Overbought/Oversold Conditions
If the price touches or goes above the upper band 🔼, it may be overbought (potential to sell).
If the price hits or goes below the lower band 🔽, it may be oversold (potential to buy).
🔁 2. Mean Reversion Strategy
Prices often return to the middle band (SMA) ➡️ after touching either the upper or lower band.
This is called a reversion to the mean strategy.
💥 3. Breakout Signals
Bollinger Band Squeeze: When the bands contract tightly, it usually signals a big move coming soon — but it doesn't say in which direction.
Traders look for breakouts after the squeeze to catch a new trend.
⚠️ Pro Tips
❌ Don't use Bollinger Bands alone — combine them with other indicators like RSI or MACD for better accuracy.
⏱️ Timeframe matters! They behave differently on a 5-minute chart than a daily chart.
📚 Practice in a demo account before using real money.
🧠 In Summary
Bollinger Bands help you:
Spot trends 🧭
Identify volatility 🌪️
Time entries & exits 📅
They're a powerful ally in any trader’s toolbox — just remember: no indicator is 100% accurate! 🎯
20+ years in global markets — from the London Stock Exchange to the New York Stock Exchange — mastering Europe’s pulse and Wall Street’s edge.
Disclaimer
The information and publications are not meant to be, and do not constitute, financial, investment, trading, or other types of advice or recommendations supplied or endorsed by TradingView. Read more in the Terms of Use.