Tesla  TSLA will report earnings this week at a time when the stock is trailing the S&P 500 year to date, although it's beating the key index in the six-month, one-year and five-year periods. What does the electric-vehicle giant's technical and fundamental analysis say?
Let's check things out:
Tesla's Fundamental Analysis
It wasn't that long ago (2023) that CEO Elon Musk forecast that TSLA could end up producing roughly 250,000 Cybertrucks per year.
But so far, that projection has been a "no-go." Cox Automotive reported the other day that the electric-vehicle giant sold just some 5,400 of the trucks in Q3. That's a 63% year-over-year contraction -- and for comparison's sake, Ford F sold more than 207,000 F-Series pickups during the same period, including 10,000 F-150 Lightning electric trucks.
Meanwhile, Car and Driver recently reported that the lower-cost Cybertruck Long Range model doesn't match the range of the (admittedly more expensive) dual-motor R1T electric pickup from Rivian RIVN .
But all is not lost, sort of, for Tesla.
The EV giant recently released Q3 delivery figures and reported that it shipped some 497,100 vehicles overall -- a record for the firm, and better than the 448,000 consensus that Tesla watchers had expected.
Apparently, there was an end-of-quarter rush as U.S. consumers tried to take advantage of a $7,500 federal electric-vehicle tax credit before the benefit expired on Sept. 30.
Tesla also built 447,000 vehicles during Q3 (a different metric from the number of cars delivered).
As for earnings, analysts' consensus view calls for Tesla to report $0.55 in adjusted earnings per share on about $26.6 billion of revenue when the firm releases results Wednesday after the bell. That would represent a 23.6% drop from the $0.72 in adjusted EPS that Tesla reported in the same period a year earlier, while reflecting 5.6% year-over-year growth from Q3 2024's $25.2 billion in revenue.
Still, 16 of the 25 sell-side analysts that I know of who cover TSLA have boosted their Q3 earnings estimates since the quarter started, while only five have revised things downward. (Four have left their estimates unchanged.)
Tesla's Technical Analysis
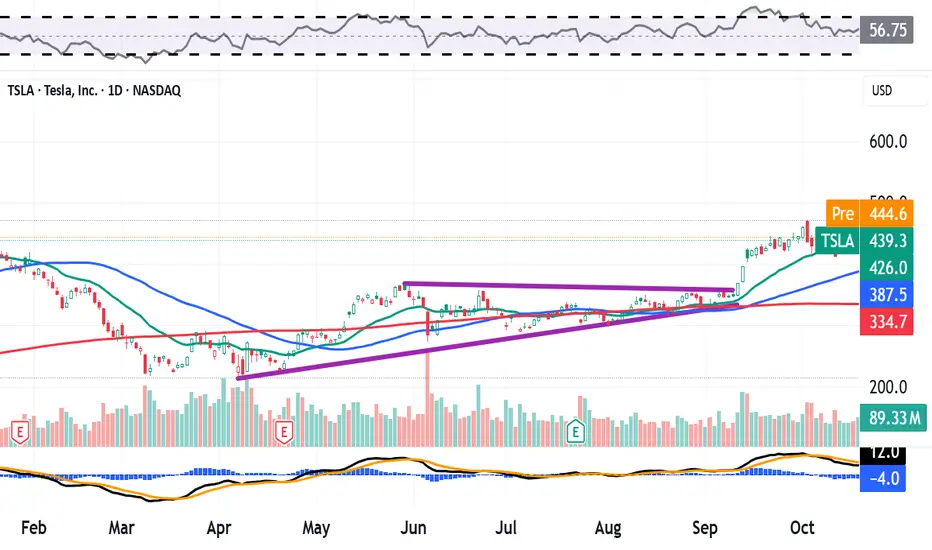
Now let's look at TSLA's year-to-date chart as of Tuesday afternoon:

Readers will see that a "closing-pennant" pattern (marked with purple lines) produced a mid-September breakout for the stock.
Closing pennants historically foretell a sharp spike in volatility for a stock, but don't tell you which direction the move will be: up or down.
In this case, Tesla went higher and built upon the breakout that the stock saw in May from a double-bottom pattern of bullish reversal (the jagged lines at the chart's left).
The stock apexed on Oct. 2 at $470, which is about what some investors might have expected from such a set-up. (Tesla closed Friday at $439.31.)
Now, TSLA looks as if it might have topped going into earnings, and the stock has recently relied upon its 21-day Exponential Moving Average (or "EMA," marked with a green line at $423.60 in the chart above) for support.
This suggests that the swing crowd is likely playing this earnings release, which could lead to some increased volatility after Tesla's Q3 numbers come out.
Looking at Tesla's secondary technical indicators, the stock's Relative Strength Index (the gray line at the chart's top) has drawn back towards neutral after exploding into technically overbought territory in September.
That said, assessing Tesla's daily Moving Average Convergence Divergence indication (or "MACD," denoted by black and gold lines and blue bars at the chart's bottom) is tricky.
The histogram of the 9-day EMA (the blue bars) dropped into sub-zero territory in early October, which is typically a short-term bearish technical signal.
However, both the 12-day EMA (the black line) and the 26-day EMA (the gold line) are still above that zero-bound, which implies a short- to medium-term bullish condition. Still, the 12-day line has crossed below the 26-day line. That's usually a bearish signal.
(Moomoo Technologies Inc. Markets Commentator Stephen "Sarge" Guilfoyle was long TSLA and F at the time of writing this column.)
This article discusses technical analysis, other approaches, including fundamental analysis, may offer very different views. The examples provided are for illustrative purposes only and are not intended to be reflective of the results you can expect to achieve. Specific security charts used are for illustrative purposes only and are not a recommendation, offer to sell, or a solicitation of an offer to buy any security. Past investment performance does not indicate or guarantee future success. Returns will vary, and all investments carry risks, including loss of principal. This content is also not a research report and is not intended to serve as the basis for any investment decision. The information contained in this article does not purport to be a complete description of the securities, markets, or developments referred to in this material. Moomoo and its affiliates make no representation or warranty as to the article's adequacy, completeness, accuracy or timeliness for any particular purpose of the above content. Furthermore, there is no guarantee that any statements, estimates, price targets, opinions or forecasts provided herein will prove to be correct.
Options trading is risky and not appropriate for everyone. Read the Options Disclosure Document (https://j.moomoo.com/017y9J) before trading. Options are complex and you may quickly lose the entire investment. Supporting docs for any claims will be furnished upon request.
Options trading subject to eligibility requirements. Strategies available will depend on options level approved.
Maximum potential loss and profit for options are calculated based on the single leg or an entire multi-leg trade remaining intact until expiration with no option contracts being exercised or assigned. These figures do not account for a portion of a multi-leg strategy being changed or removed or the trader assuming a short or long position in the underlying stock at or before expiration. Therefore, it is possible to lose more than the theoretical max loss of a strategy.
Moomoo is a financial information and trading app offered by Moomoo Technologies Inc. In the U.S., investment products and services on Moomoo are offered by Moomoo Financial Inc., Member FINRA/SIPC.
TradingView is an independent third party not affiliated with Moomoo Financial Inc., Moomoo Technologies Inc., or its affiliates. Moomoo Financial Inc. and its affiliates do not endorse, represent or warrant the completeness and accuracy of the data and information available on the TradingView platform and are not responsible for any services provided by the third-party platform.
Let's check things out:
Tesla's Fundamental Analysis
It wasn't that long ago (2023) that CEO Elon Musk forecast that TSLA could end up producing roughly 250,000 Cybertrucks per year.
But so far, that projection has been a "no-go." Cox Automotive reported the other day that the electric-vehicle giant sold just some 5,400 of the trucks in Q3. That's a 63% year-over-year contraction -- and for comparison's sake, Ford
Meanwhile, Car and Driver recently reported that the lower-cost Cybertruck Long Range model doesn't match the range of the (admittedly more expensive) dual-motor R1T electric pickup from Rivian
But all is not lost, sort of, for Tesla.
The EV giant recently released Q3 delivery figures and reported that it shipped some 497,100 vehicles overall -- a record for the firm, and better than the 448,000 consensus that Tesla watchers had expected.
Apparently, there was an end-of-quarter rush as U.S. consumers tried to take advantage of a $7,500 federal electric-vehicle tax credit before the benefit expired on Sept. 30.
Tesla also built 447,000 vehicles during Q3 (a different metric from the number of cars delivered).
As for earnings, analysts' consensus view calls for Tesla to report $0.55 in adjusted earnings per share on about $26.6 billion of revenue when the firm releases results Wednesday after the bell. That would represent a 23.6% drop from the $0.72 in adjusted EPS that Tesla reported in the same period a year earlier, while reflecting 5.6% year-over-year growth from Q3 2024's $25.2 billion in revenue.
Still, 16 of the 25 sell-side analysts that I know of who cover TSLA have boosted their Q3 earnings estimates since the quarter started, while only five have revised things downward. (Four have left their estimates unchanged.)
Tesla's Technical Analysis
Now let's look at TSLA's year-to-date chart as of Tuesday afternoon:
Readers will see that a "closing-pennant" pattern (marked with purple lines) produced a mid-September breakout for the stock.
Closing pennants historically foretell a sharp spike in volatility for a stock, but don't tell you which direction the move will be: up or down.
In this case, Tesla went higher and built upon the breakout that the stock saw in May from a double-bottom pattern of bullish reversal (the jagged lines at the chart's left).
The stock apexed on Oct. 2 at $470, which is about what some investors might have expected from such a set-up. (Tesla closed Friday at $439.31.)
Now, TSLA looks as if it might have topped going into earnings, and the stock has recently relied upon its 21-day Exponential Moving Average (or "EMA," marked with a green line at $423.60 in the chart above) for support.
This suggests that the swing crowd is likely playing this earnings release, which could lead to some increased volatility after Tesla's Q3 numbers come out.
Looking at Tesla's secondary technical indicators, the stock's Relative Strength Index (the gray line at the chart's top) has drawn back towards neutral after exploding into technically overbought territory in September.
That said, assessing Tesla's daily Moving Average Convergence Divergence indication (or "MACD," denoted by black and gold lines and blue bars at the chart's bottom) is tricky.
The histogram of the 9-day EMA (the blue bars) dropped into sub-zero territory in early October, which is typically a short-term bearish technical signal.
However, both the 12-day EMA (the black line) and the 26-day EMA (the gold line) are still above that zero-bound, which implies a short- to medium-term bullish condition. Still, the 12-day line has crossed below the 26-day line. That's usually a bearish signal.
(Moomoo Technologies Inc. Markets Commentator Stephen "Sarge" Guilfoyle was long TSLA and F at the time of writing this column.)
This article discusses technical analysis, other approaches, including fundamental analysis, may offer very different views. The examples provided are for illustrative purposes only and are not intended to be reflective of the results you can expect to achieve. Specific security charts used are for illustrative purposes only and are not a recommendation, offer to sell, or a solicitation of an offer to buy any security. Past investment performance does not indicate or guarantee future success. Returns will vary, and all investments carry risks, including loss of principal. This content is also not a research report and is not intended to serve as the basis for any investment decision. The information contained in this article does not purport to be a complete description of the securities, markets, or developments referred to in this material. Moomoo and its affiliates make no representation or warranty as to the article's adequacy, completeness, accuracy or timeliness for any particular purpose of the above content. Furthermore, there is no guarantee that any statements, estimates, price targets, opinions or forecasts provided herein will prove to be correct.
Options trading is risky and not appropriate for everyone. Read the Options Disclosure Document (https://j.moomoo.com/017y9J) before trading. Options are complex and you may quickly lose the entire investment. Supporting docs for any claims will be furnished upon request.
Options trading subject to eligibility requirements. Strategies available will depend on options level approved.
Maximum potential loss and profit for options are calculated based on the single leg or an entire multi-leg trade remaining intact until expiration with no option contracts being exercised or assigned. These figures do not account for a portion of a multi-leg strategy being changed or removed or the trader assuming a short or long position in the underlying stock at or before expiration. Therefore, it is possible to lose more than the theoretical max loss of a strategy.
Moomoo is a financial information and trading app offered by Moomoo Technologies Inc. In the U.S., investment products and services on Moomoo are offered by Moomoo Financial Inc., Member FINRA/SIPC.
TradingView is an independent third party not affiliated with Moomoo Financial Inc., Moomoo Technologies Inc., or its affiliates. Moomoo Financial Inc. and its affiliates do not endorse, represent or warrant the completeness and accuracy of the data and information available on the TradingView platform and are not responsible for any services provided by the third-party platform.
Disclaimer
The information and publications are not meant to be, and do not constitute, financial, investment, trading, or other types of advice or recommendations supplied or endorsed by TradingView. Read more in the Terms of Use.
Disclaimer
The information and publications are not meant to be, and do not constitute, financial, investment, trading, or other types of advice or recommendations supplied or endorsed by TradingView. Read more in the Terms of Use.