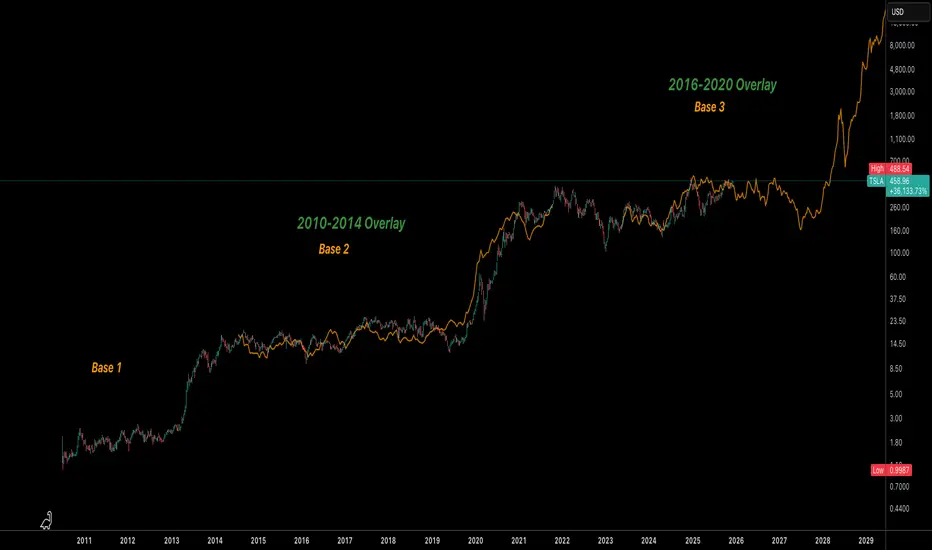
This is a TSLA weekly log-scale structure study that overlays prior “bases” onto the current price action to highlight Tesla’s repeating rhythm over the last decade-plus. Base 1 is normalized and overlaid onto Base 2, and Base 2 is then overlaid onto the current Base 3 to compare how Tesla historically moves from long, flat ranges into powerful expansion legs.
In both earlier cases, Tesla spent years in a broad, grinding base before resolving higher in a sharp, almost parabolic advance. The Base 1 → Base 2 overlay shows remarkably similar sequences: slow accumulation, a fake‑out or shakeout, then a sustained markup phase. The Base 2 → Base 3 overlay suggests the current structure is tracking that same rhythm on a higher price and market‑cap regime.
If this overlay continues to “rhythmically” follow Base 2, the message is not immediate liftoff, but a period of relatively flat / range‑bound trading first—choppy price action that compresses and frustrates, much like the late stages of Base 2 before Tesla finally broke out. The fractal implies that the market may need more time to digest, rotate ownership, and build energy before any potential next expansion leg. This would essentially be in the accumulation phase.
A clean break and hold above the upper end of the current multi‑year range would be the structural confirmation that the base has resolved; losing the lower band of the range for an extended period would weaken or invalidate the fractal. The overlay is used here to compare tempo and structure, not to project precise price targets or timing.
On a fundamental level, past parabolic phases in TSLA have coincided with inflection points in the story: rapid EV volume scaling, margin expansion, index inclusion, and a step‑change in investor perception of Tesla from “speculative automaker” to “platform / technology company.” Future parabolic behavior would likely need a similar kind of narrative and numbers shift:
• Clear evidence of sustained earnings and free‑cash‑flow growth from core EVs and new products (energy, autonomy, robotics, software).
• Large addressable markets actually converting into visible revenue and margin expansion, not just promises.
• A macro backdrop that supports risk assets and growth multiples, allowing the market to re‑rate Tesla higher again.
As market cap grows, each new cycle tends to require more time and more fundamental proof to justify a major re‑rating, which fits with the idea that these bases get longer even if the long‑term trend remains up. Percentage gains may compress, but the dollar move can still be huge—another reason the log scale is essential for seeing the real structure.
This is a structural and narrative framework, not financial advice. The overlay highlights how Tesla has “rhymed” in the past; whether it does so again will depend on execution, competition, macro conditions, and how the market chooses to re‑price the story this time.
Disclaimer
The information and publications are not meant to be, and do not constitute, financial, investment, trading, or other types of advice or recommendations supplied or endorsed by TradingView. Read more in the Terms of Use.
Disclaimer
The information and publications are not meant to be, and do not constitute, financial, investment, trading, or other types of advice or recommendations supplied or endorsed by TradingView. Read more in the Terms of Use.