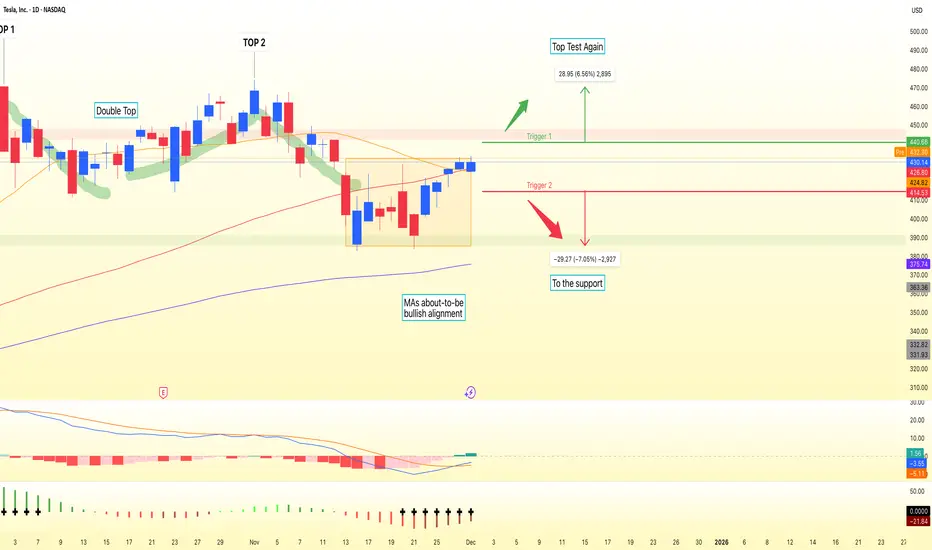
Tesla on the daily chart is stuck in a tight battleground between structure and momentum. Price is consolidating below the 20- and 60-day moving averages after a bearish Market Structure Shift in early November, while still holding above the long-term 120-day moving average. The result is a classic Bear Flag look: a sharp downside pole followed by a choppy, upward-sloping consolidation between the $400 demand zone and $440 supply zone.
As long as TSLA trades inside this band, it’s a range game. The primary path is continuation lower if the Bear Flag resolves as expected. A daily close below roughly $415 would put pressure on the $400 support and open the way toward the $385 area, aligning with the flag breakdown logic and recent downside momentum. For this bearish continuation view, a sustained close back above $430–440 would effectively invalidate the pattern and suggest sellers are losing control.
On the flip side, a clean daily close above $440 would flip the script, clearing both key moving averages and turning the zone into support. That breakout could unlock a move toward the prior October swing region around $470, with the idea invalidated if price drops back into the range and especially below $400. This is a study, not financial advice. Manage risk and invalidations.
Thought of the Day 💡: Often the edge is in letting the market show its hand at the extremes of the range, not in guessing the next candle.
-------------------------
Thanks for your support!
If you found this idea helpful or learned something new, drop a like 👍 and leave a comment, I’d love to hear your thoughts!
follow my X 👉 x.com/bbqgio
🔥 level up your Stock, FX, & Crypto: VIP access to AI technical analysis and pro market insights at TradeOS + 80%-off promo code 'EARLY' 👉
ai.tradeos.xyz/?utm_source=tvbg
🔥 level up your Stock, FX, & Crypto: VIP access to AI technical analysis and pro market insights at TradeOS + 80%-off promo code 'EARLY' 👉
ai.tradeos.xyz/?utm_source=tvbg
Related publications
Disclaimer
The information and publications are not meant to be, and do not constitute, financial, investment, trading, or other types of advice or recommendations supplied or endorsed by TradingView. Read more in the Terms of Use.