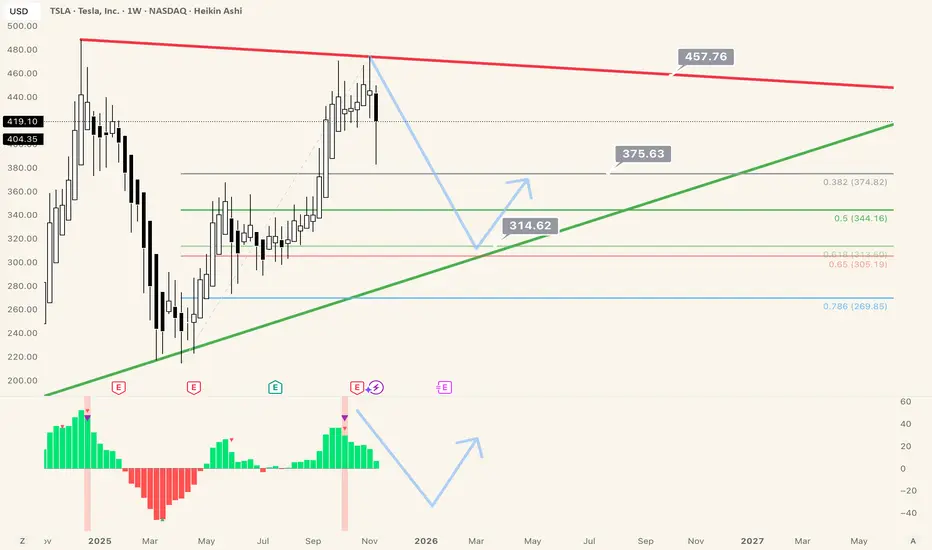
The weekly chart shows TSLA in a multi-month consolidation, forming what looks like a symmetrical triangle or wedge pattern. Price has been respecting a descending resistance line, sloping down from highs near 470s to current levels, and an ascending support line, rising from lows around 214-310 toward ~344-374.
If history repeats itself, we can see on the chart that our pull back in recent weeks from highs near 474 (early November) may continue to down to the bottom of the trend at around to 350 depending upon the timing. if it happens fast, the bottom of the channel will be much lower around 306-314.
I think above 383 level we can continue our consolidation and upward trajectory if we break 429 with volume support.
Unfortunately, given what I see in my modified MACD indicator, I think the most likely scenario is we rally to 429 and get rejected to go down and test 375 level and possibly below that go visit 314 to 340 zone.
Also 12-week cumulative VWAP at 415.78. Price is below this level (404.35), indicating short-term bearish bias, but proximity suggests potential mean reversion if momentum flips.
This is a weekly chart so this will take some time to play out. I will be accumulating TSLA below 383 level.
E.O. Breakers
@cryptowhenlambo
linktr.ee/cryptobreakers
patreon.com/CryptoWhenLambo
@cryptowhenlambo
linktr.ee/cryptobreakers
patreon.com/CryptoWhenLambo
Disclaimer
The information and publications are not meant to be, and do not constitute, financial, investment, trading, or other types of advice or recommendations supplied or endorsed by TradingView. Read more in the Terms of Use.