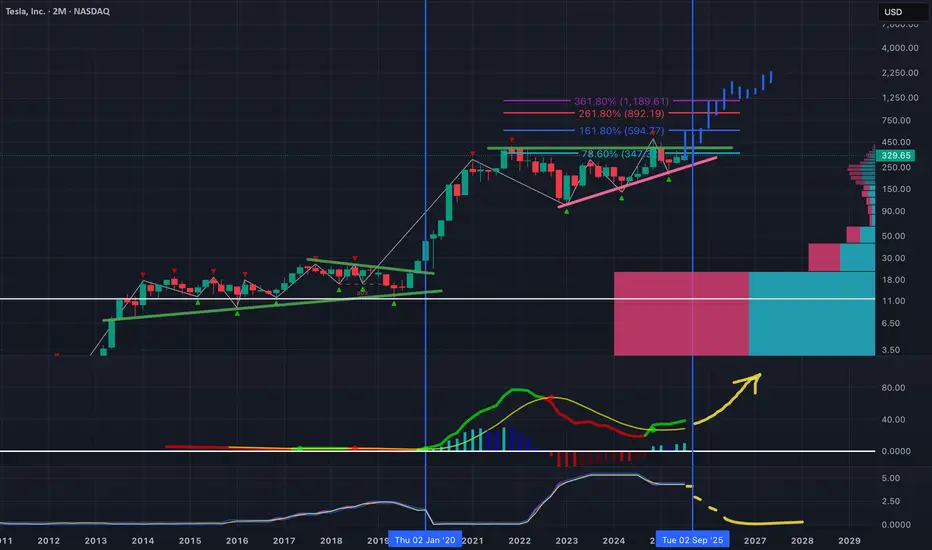
Tesla’s long-term bullish structure remains intact on the 2-month logarithmic chart, with price breaking out of a two-year ascending triangle capped near $350. This move tests the 78.6% retracement level at $347, opening the door to Fibonacci extension targets at approximately $595, $892, and $1,189 if momentum follows through.
The volume profile highlights strong historical support in the $180–$250 range, a key zone to defend on any pullback. Notably, the macro backdrop adds a tailwind — the last significant Fed rate cut in early 2020 coincided with Tesla’s parabolic advance, and the next major cut is projected for late 2025.
Long-term momentum indicators are turning higher, suggesting the early phase of a new bullish cycle. A sustained hold above $300 on any retest would reinforce the breakout, while a drop back under $280 risks a move toward $200–$220.
I wouldn't want to be short long term.
Disclaimer
The information and publications are not meant to be, and do not constitute, financial, investment, trading, or other types of advice or recommendations supplied or endorsed by TradingView. Read more in the Terms of Use.
Disclaimer
The information and publications are not meant to be, and do not constitute, financial, investment, trading, or other types of advice or recommendations supplied or endorsed by TradingView. Read more in the Terms of Use.