TTEC (NASDAQ)
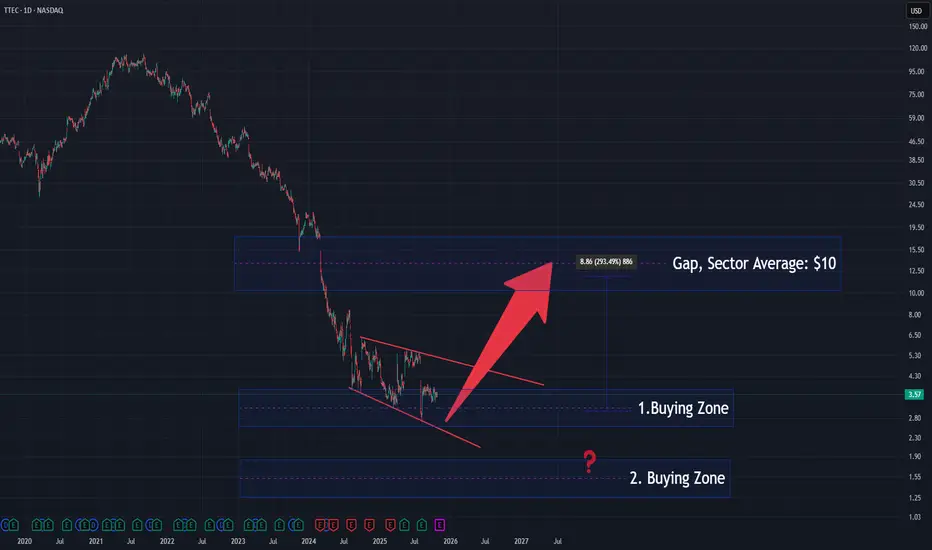
The price structure is forming a descending diagonal, suggesting a potential exhaustion phase of the ongoing downtrend.
The stock is currently trading inside the 1st Buying Zone, with a possible deeper test toward the 2nd Buying Zone before a sustained reversal begins.
The sector average stands near $10, aligning with the gap area, which could act as a major upside target if accumulation continues.
📈 A confirmed breakout from the diagonal pattern would strengthen the bullish bias toward that sector-level equilibrium.
💼 Professional market insights & charts:
cakirinsights.com/
cakirinsights.com/
Disclaimer
The information and publications are not meant to be, and do not constitute, financial, investment, trading, or other types of advice or recommendations supplied or endorsed by TradingView. Read more in the Terms of Use.