Price Action & Trend
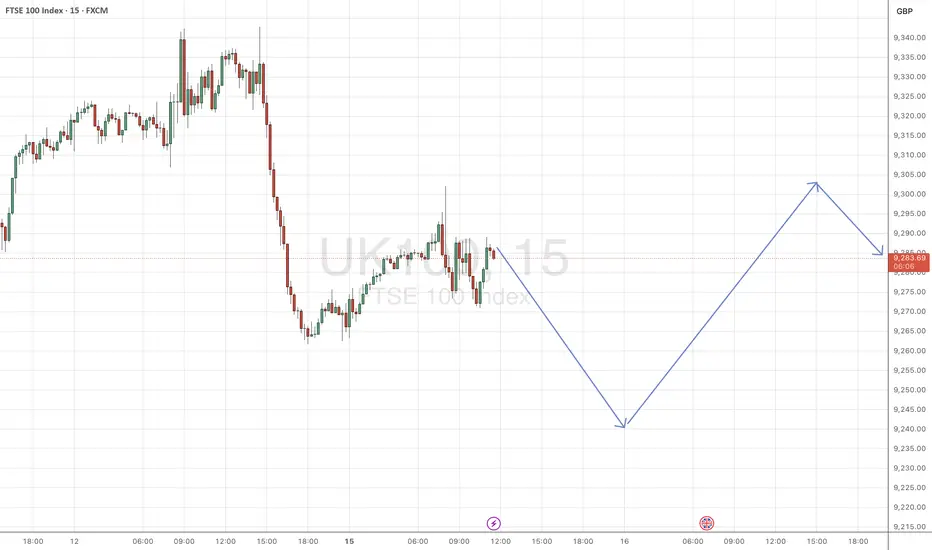
The FTSE is currently at 9,281.7, just below the daily pivot (9,289).
Price is trading within a rising trend channel (red lines).
Higher lows since early September suggest short-term bullish momentum.
Moving Averages (EMA 10, 25, 200)
EMA (10) and EMA (25) are pointing upward, supporting short-term bullishness.
Price is above the EMA (200), confirming the longer-term uptrend is intact.
Pivot Points (Support/Resistance)
Pivot (P): 9,289 → price is hovering around here.
R1: 9,318, R2: 9,369, R3: 9,398 → upside resistance levels.
S1: 9,256, S2: 9,218, S3: 9,158 → downside support levels.
RSI (10)
RSI at ~58.4 → neutral to bullish, not yet overbought.
Trading Ideas
📈 Bullish Setup (trend-following)
Buy near support: ideally around S1 (9,256) or EMA (25).
Target: R1 (9,318), then R2 (9,369).
Stop-loss: below S2 (9,218).
📉 Bearish Setup (counter-trend / pullback)
Short near resistance: R1 (9,318) or upper channel line.
Target: back to Pivot (9,289) or S1 (9,256).
Stop-loss: above R2 (9,369).
⚠️ Neutral / Range Play
Since price is consolidating around the daily pivot, intraday traders might scalp between S1 (9,256) and R1 (9,318) until a breakout occurs.
Disclaimer
The information and publications are not meant to be, and do not constitute, financial, investment, trading, or other types of advice or recommendations supplied or endorsed by TradingView. Read more in the Terms of Use.
Disclaimer
The information and publications are not meant to be, and do not constitute, financial, investment, trading, or other types of advice or recommendations supplied or endorsed by TradingView. Read more in the Terms of Use.