Union Bank of India engages in the provision of commercial banking services. It also offers personal and corporate loans. The firm operates through the following segments: Treasury Operations, Corporate and Wholesale Banking, Retail Banking Operations and Other Banking Operations.
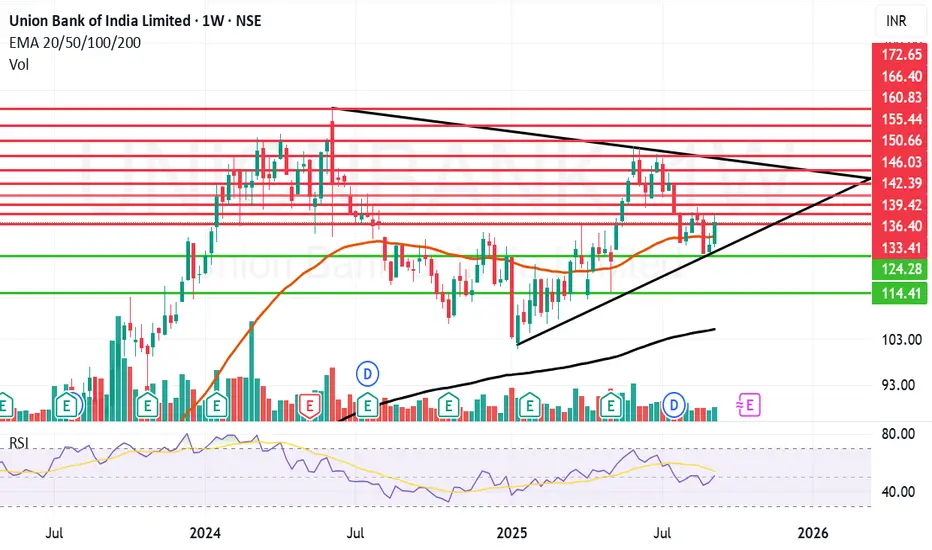
Union Bank of India, Closing price is 133.88. Dividend Yield CMP = 3.56%. The positive aspects of the company are very attractive Valuation (P.E. = 5.4), Companies with Zero Promoter Pledge, Company able to generate Net Cash, Companies with Low Debt, FII / FPI or Institutions increasing their shareholding and MFs increased their shareholding last quarter. The Negative aspects of the company are Stocks Underperforming their Industry Price Change in the Quarter, Increase in Provisions in Recent Results, De-growth in Revenue, Profits and Operating Profit Margin in recent results (QoQ) and Companies with high market cap, lower public shareholding.
Entry can be taken after closing above 134 Historical Resistance in the stock will be 136, 139, 142 and 146. PEAK Historic Resistance in the stock will be 150, 155 and 160. Stop loss in the stock should be maintained at Closing below 124 or 114 depending upon your risk taking ability.
A smart investor would be a person who looks at both fundamentals and technicals of the company and invests in a fundamentally strong company which is giving a technical breakout. For this one has to learn Techno-Funda analysis. I have written a book on the subject called The Happy Candles Way To Wealth Creation. In this book you will learn the basics of Techno-Funda investing. The book is available on Amazon and is one of the highest rated books in its category. With an approval rating of 4.8/5 as on date. Lot of investors call it as a Hand book for Techno Funda investing. Most of the chapters are standalone and can be read at your own accord. It will be really helpful to you. To know more about Mother line, Father line and my Mother, Father and Small child theory, Parallel Channel you should once again I recommend, read my book the Happy Candles Way to Wealth Creation.
Disclaimer: The above information is provided for educational purpose, analysis and paper trading only. Please don't treat this as a buy or sell recommendation for the stock or index. The Techno-Funda analysis is based on data that is more than 3 months old. Supports and Resistances are determined by historic past peaks and Valley in the chart. Many other indicators and patterns like EMA, RSI, MACD, Volumes, Fibonacci, parallel channel etc. use historic data which is 3 months or older cyclical points. There is no guarantee they will work in future as markets are highly volatile and swings in prices are also due to macro and micro factors based on actions taken by the company as well as region and global events. Equity investment is subject to risks. I or my clients or family members might have positions in the stocks that we mention in our educational posts. We will not be responsible for any Profit or loss that may occur due to any financial decision taken based on any data provided in this message. Do consult your investment advisor before taking any financial decisions. Stop losses should be an important part of any investment in equity.
Disclaimer
The information and publications are not meant to be, and do not constitute, financial, investment, trading, or other types of advice or recommendations supplied or endorsed by TradingView. Read more in the Terms of Use.
Disclaimer
The information and publications are not meant to be, and do not constitute, financial, investment, trading, or other types of advice or recommendations supplied or endorsed by TradingView. Read more in the Terms of Use.