Based on Weekly Timeframe, Logarithmic Scale
This is a high-conviction breakout. The stock has decisively broken a 4.5-year angular resistance, driven by a blockbuster quarterly earnings report that confirmed a strong business turnaround. The alignment of high-timeframe indicators suggests a new long-term uptrend is beginning.
🚀 1. The Fundamental Catalyst (The "Why")
The technical breakout is not random. It is a direct response to strong Q2 2026 earnings:
- Strong Profitability: The company reported a 40% year-over-year growth in EBITDA and a net profit of ₹553 crore, a massive turnaround from the net loss reported in the same quarter last year.
- Upgraded Guidance: Management upgraded its full-year EBITDA growth guidance, signaling confidence in the business.
- Market Reaction: This news provided the "fuel" for the market to absorb supply and break the multi-year resistance.
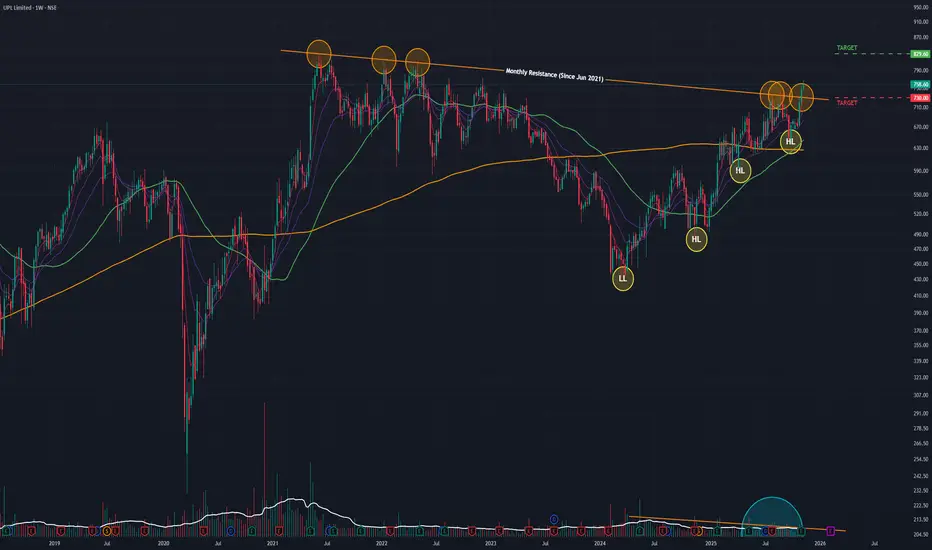
📈 2. The Long-Term Setup (The "Big Picture")
- The 2021 Peak: After its ATH in June 2021, the stock was capped by a long-term angular resistance trendline.
- The 2024 Bottom: The stock was in a corrective downtrend, which found its ultimate bottom in March 2024.
- The Reversal: Since that low, the stock has been in a steady reversal, forming a bullish structure of Higher Lows.
- The "Lid": This recovery was repeatedly halted by the 4.5-year angular resistance, which it failed to break on previous attempts.
📊 3. The Decisive Breakout (The Past Two Weeks)
- Week of Nov 03: The stock broke out and closed above the angular resistance for the first time.
- Week of Nov 10: The stock confirmed the breakout with a gap-up open and a further 1.42% gain.
- Volume: The volume during the March 2024 uptrend was low (a "wall of worry"), but the breakout and confirmation weeks saw above-average volume (12.29 Million last week), confirming institutional interest.
🎯 4. Confluence of Indicators
Indicator analysis confirms the new long-term trend. This "trifecta" of bullishness on high timeframes is very powerful:
- EMAs: Short-term Exponential Moving Averages are in a "PCO" (Price Crossover) state on both the Monthly and Weekly charts.
- RSI: The Relative Strength Index is rising on both the Monthly and Weekly charts.
🧠 5. Short-Term Caution & Future Scenarios
- The "Inverted Hammer": The last daily candle of the week was an "inverted hammer." This is a sign of short-term indecision and profit-taking. It signals that while the breakout is valid, it's meeting immediate supply, and a healthy pullback or "re-test" is highly possible.
- Conclusion: The trend is now bullish, but the entry point is key.
🐂 The Bullish Case (Continuation)
- Trigger: The bullish momentum continues, absorbing the short-term profit-taking.
- Target: The next logical price target is ₹830.
🐻 The Pullback Case (Healthy Re-test)
- Trigger: If the "inverted hammer" plays out and momentum is lost in the short term.
- Support: The price would likely fall to re-test the angular resistance-turned-support at ₹730. A "bounce" off this level would be a classic, healthy confirmation of the breakout.
This is a high-conviction breakout. The stock has decisively broken a 4.5-year angular resistance, driven by a blockbuster quarterly earnings report that confirmed a strong business turnaround. The alignment of high-timeframe indicators suggests a new long-term uptrend is beginning.
🚀 1. The Fundamental Catalyst (The "Why")
The technical breakout is not random. It is a direct response to strong Q2 2026 earnings:
- Strong Profitability: The company reported a 40% year-over-year growth in EBITDA and a net profit of ₹553 crore, a massive turnaround from the net loss reported in the same quarter last year.
- Upgraded Guidance: Management upgraded its full-year EBITDA growth guidance, signaling confidence in the business.
- Market Reaction: This news provided the "fuel" for the market to absorb supply and break the multi-year resistance.
📈 2. The Long-Term Setup (The "Big Picture")
- The 2021 Peak: After its ATH in June 2021, the stock was capped by a long-term angular resistance trendline.
- The 2024 Bottom: The stock was in a corrective downtrend, which found its ultimate bottom in March 2024.
- The Reversal: Since that low, the stock has been in a steady reversal, forming a bullish structure of Higher Lows.
- The "Lid": This recovery was repeatedly halted by the 4.5-year angular resistance, which it failed to break on previous attempts.
📊 3. The Decisive Breakout (The Past Two Weeks)
- Week of Nov 03: The stock broke out and closed above the angular resistance for the first time.
- Week of Nov 10: The stock confirmed the breakout with a gap-up open and a further 1.42% gain.
- Volume: The volume during the March 2024 uptrend was low (a "wall of worry"), but the breakout and confirmation weeks saw above-average volume (12.29 Million last week), confirming institutional interest.
🎯 4. Confluence of Indicators
Indicator analysis confirms the new long-term trend. This "trifecta" of bullishness on high timeframes is very powerful:
- EMAs: Short-term Exponential Moving Averages are in a "PCO" (Price Crossover) state on both the Monthly and Weekly charts.
- RSI: The Relative Strength Index is rising on both the Monthly and Weekly charts.
🧠 5. Short-Term Caution & Future Scenarios
- The "Inverted Hammer": The last daily candle of the week was an "inverted hammer." This is a sign of short-term indecision and profit-taking. It signals that while the breakout is valid, it's meeting immediate supply, and a healthy pullback or "re-test" is highly possible.
- Conclusion: The trend is now bullish, but the entry point is key.
🐂 The Bullish Case (Continuation)
- Trigger: The bullish momentum continues, absorbing the short-term profit-taking.
- Target: The next logical price target is ₹830.
🐻 The Pullback Case (Healthy Re-test)
- Trigger: If the "inverted hammer" plays out and momentum is lost in the short term.
- Support: The price would likely fall to re-test the angular resistance-turned-support at ₹730. A "bounce" off this level would be a classic, healthy confirmation of the breakout.
Disclaimer: This analysis is my personal view & for educational purposes only. They shall not be construed as trade or investment advice. Before making any financial decision, it is imperative that you consult with a qualified financial professional.
Disclaimer
The information and publications are not meant to be, and do not constitute, financial, investment, trading, or other types of advice or recommendations supplied or endorsed by TradingView. Read more in the Terms of Use.