Hey traders 👋
The US100 (NASDAQ 100) is currently sitting in a very interesting technical position on the 4-hour chart.
Let’s break it down 👇
🧭 Structure Overview
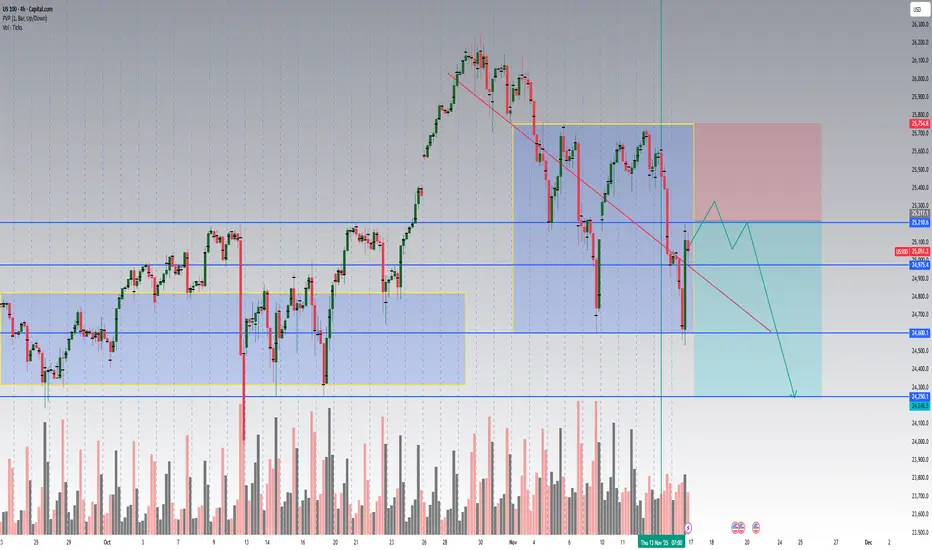
After a strong bullish leg that peaked near 25,800, the index entered a descending corrective channel.
We’ve now hit an important support cluster around 24,975 – 25,000, which previously acted as a pivot zone.
I’ve mapped two main liquidity boxes (blue & yellow) that show where buyers and sellers built positions during the last phases of consolidation.
Notice how price rejected from the upper boundary of the yellow box twice — confirming short-term supply pressure.
📊 Volume Analysis
Volume has been elevated on each red candle, confirming that this down-move isn’t just a retracement without conviction.
However, the most recent bar shows a strong bullish reaction on higher volume, indicating potential absorption — smart money may be defending the 25K handle.
If we see declining volume on the next two green candles → likely dead cat bounce.
If volume expands again above 25,200 → we might get a break and retest of the red trendline for a short-term continuation toward 25,600–25,750.
🧱 Key Levels
Zone Bias Comment
25 210 – 25 220 Resistance Prior liquidity flip zone, possible rejection area
24 975 – 25 000 Current support Reaction zone, watch for confirmation candle
24 600 Target 1 Measured-move projection
24 250 – 24 300 Target 2 Major daily demand zone / possible higher-low base
🔻 Bearish Scenario (Primary Plan)
Short bias remains valid below 25 210.
Expect a short-term bounce into 25 100–25 200, then rejection.
Targets: 24 600 → 24 250.
Invalidation: close above 25 220 on strong volume (would flip the structure bullish).
🟢 Bullish Alternative
If bulls can close a 4H candle above 25 210 – 25 220 with confirmed volume > previous red bar,
the down-channel breaks, and we may see a fast rally back to 25 600 – 25 750.
⚙️ Strategy Note
This chart is for educational & analytical purposes — not financial advice.
I’ll update if we get confirmation on the next 4-hour candle.
👉 Follow for updates and let me know your view — will the 25K zone hold or break next week?
📅 Summary
Trend: Medium-term uptrend, short-term correction
Bias: Bearish below 25 210
Setup: Channel rejection → continuation toward 24 600 / 24 250
Risk: Volume-based breakout above 25 220
Hit 👍 and follow if you found this breakdown helpful — I post detailed NAS100 / SPX / DAX updates every week with volume-based setups.
Let’s grow the community together 🚀
Would you like me to format it with hashtags and keyword tags (so it ranks better in TradingView search, like #US100 #NASDAQ #TechnicalAnalysis #PriceAction #VolumeProfile)? I can add that next.
The US100 (NASDAQ 100) is currently sitting in a very interesting technical position on the 4-hour chart.
Let’s break it down 👇
🧭 Structure Overview
After a strong bullish leg that peaked near 25,800, the index entered a descending corrective channel.
We’ve now hit an important support cluster around 24,975 – 25,000, which previously acted as a pivot zone.
I’ve mapped two main liquidity boxes (blue & yellow) that show where buyers and sellers built positions during the last phases of consolidation.
Notice how price rejected from the upper boundary of the yellow box twice — confirming short-term supply pressure.
📊 Volume Analysis
Volume has been elevated on each red candle, confirming that this down-move isn’t just a retracement without conviction.
However, the most recent bar shows a strong bullish reaction on higher volume, indicating potential absorption — smart money may be defending the 25K handle.
If we see declining volume on the next two green candles → likely dead cat bounce.
If volume expands again above 25,200 → we might get a break and retest of the red trendline for a short-term continuation toward 25,600–25,750.
🧱 Key Levels
Zone Bias Comment
25 210 – 25 220 Resistance Prior liquidity flip zone, possible rejection area
24 975 – 25 000 Current support Reaction zone, watch for confirmation candle
24 600 Target 1 Measured-move projection
24 250 – 24 300 Target 2 Major daily demand zone / possible higher-low base
🔻 Bearish Scenario (Primary Plan)
Short bias remains valid below 25 210.
Expect a short-term bounce into 25 100–25 200, then rejection.
Targets: 24 600 → 24 250.
Invalidation: close above 25 220 on strong volume (would flip the structure bullish).
🟢 Bullish Alternative
If bulls can close a 4H candle above 25 210 – 25 220 with confirmed volume > previous red bar,
the down-channel breaks, and we may see a fast rally back to 25 600 – 25 750.
⚙️ Strategy Note
This chart is for educational & analytical purposes — not financial advice.
I’ll update if we get confirmation on the next 4-hour candle.
👉 Follow for updates and let me know your view — will the 25K zone hold or break next week?
📅 Summary
Trend: Medium-term uptrend, short-term correction
Bias: Bearish below 25 210
Setup: Channel rejection → continuation toward 24 600 / 24 250
Risk: Volume-based breakout above 25 220
Hit 👍 and follow if you found this breakdown helpful — I post detailed NAS100 / SPX / DAX updates every week with volume-based setups.
Let’s grow the community together 🚀
Would you like me to format it with hashtags and keyword tags (so it ranks better in TradingView search, like #US100 #NASDAQ #TechnicalAnalysis #PriceAction #VolumeProfile)? I can add that next.
Do not have 30K followers, do not have to share 15 trade a day, because you pay subscription, do not live from subscription, but sharing my knowledge, analysis and trades. For free. If you want to join, you are welcomed. t.me/+CE3Vdc5m72w4MjRk
Disclaimer
The information and publications are not meant to be, and do not constitute, financial, investment, trading, or other types of advice or recommendations supplied or endorsed by TradingView. Read more in the Terms of Use.