Market Context
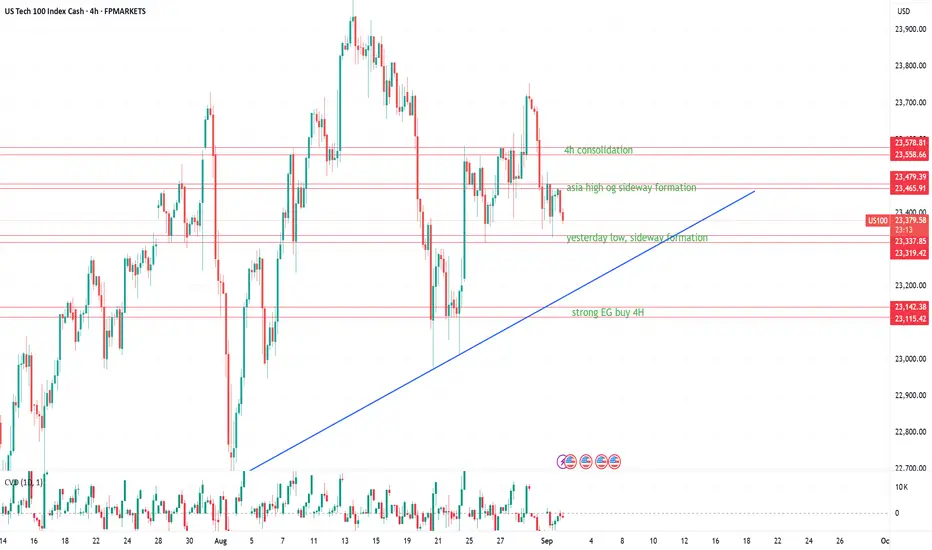
The Nasdaq-100 is currently trading within a consolidation pattern after being rejected around ~23,700. Momentum has slowed, and the market is searching for direction. During the London session, the focus is on intraday reactions around key levels. These zones may act as catalysts for either continuation or short-term reversals, depending on price action.
Sell Zones
23,465–23,480 (Asia high / sideways formation)
23,558–23,579 (4H consolidation)
Buy Zones
23,320–23,338 (Yesterday’s low / sideways formation)
23,115–23,140 (Strong 4H demand)
Market Update and Sentiment Analysis
Overall Assessment
The Nasdaq-100 (US100) currently finds itself in uncertain territory. The technology sector, historically the driving force behind the index’s performance, faced headwinds toward the end of August. Rotation into small-cap equities, rising uncertainty ahead of key macroeconomic data and the Federal Reserve’s rate decision, as well as weak technical signals, are all contributing to a mixed sentiment picture.
Market Developments
Macroeconomic Context
For the London session, the focus is on short intraday moves around well-defined supply and demand zones. Given the broader negative bias in the market, traders should be extra cautious with longs — confirmation and strong absorption signals are key before entering buys.
The Nasdaq-100 is currently trading within a consolidation pattern after being rejected around ~23,700. Momentum has slowed, and the market is searching for direction. During the London session, the focus is on intraday reactions around key levels. These zones may act as catalysts for either continuation or short-term reversals, depending on price action.
Sell Zones
23,465–23,480 (Asia high / sideways formation)
- This zone represents the top of the Asian range and extends from a sideways structure.
- A retest during London hours may trigger short-term selling momentum, especially if volume fades compared to Asian trading.
23,558–23,579 (4H consolidation)
- A clear resistance area from the latest 4H consolidation, where several bullish attempts were previously absorbed.
- If price fails to break this area with strong momentum, it is likely to act as a solid supply zone.
Buy Zones
23,320–23,338 (Yesterday’s low / sideways formation)
- Represents yesterday’s low and a key intraday balance point.
- If price dips into this area during London hours and shows absorption (e.g., long wicks / stronger CVD on the bid), it may serve as a springboard for a bounce.
23,115–23,140 (Strong 4H demand)
- The strongest buy zone on the chart, aligning with both a structural support level and a prior reaction zone on 4H.
- A test of this zone may indicate a “capitulation move,” where stronger buyers could be waiting.
Market Update and Sentiment Analysis
Overall Assessment
The Nasdaq-100 (US100) currently finds itself in uncertain territory. The technology sector, historically the driving force behind the index’s performance, faced headwinds toward the end of August. Rotation into small-cap equities, rising uncertainty ahead of key macroeconomic data and the Federal Reserve’s rate decision, as well as weak technical signals, are all contributing to a mixed sentiment picture.
Market Developments
- End of August: The Nasdaq-100 closed the month down approximately –1.2%, bringing the index to around 23,415. Despite the pullback, year-to-date performance remains up by roughly 10–11%.
- Sector Rotation: The small-cap segment (Russell 2000) gained 7.3% in August, significantly outperforming the Nasdaq-100. The shift away from technology reflects both concerns about AI profitability and expectations of future rate cuts, which traditionally favor smaller companies.
- Earnings Pressure: Weak earnings from companies such as Dell, Nvidia, and Marvell Technology disappointed the market. Margin pressure within the tech sector has raised concerns about growth prospects.
Macroeconomic Context
- Data Sensitivity: The market is displaying extreme sensitivity to employment and inflation data. Even minor deviations in key figures can trigger significant price movements.
- Federal Reserve: Investor attention is focused on the Fed’s upcoming rate decision. Expectations of a rate cut later in the year serve as a supportive factor, though uncertainty remains elevated.
- Historical Pattern: September has traditionally been the weakest month for the Nasdaq index. This increases the risk of additional volatility in the weeks ahead.
For the London session, the focus is on short intraday moves around well-defined supply and demand zones. Given the broader negative bias in the market, traders should be extra cautious with longs — confirmation and strong absorption signals are key before entering buys.
Disclaimer
The information and publications are not meant to be, and do not constitute, financial, investment, trading, or other types of advice or recommendations supplied or endorsed by TradingView. Read more in the Terms of Use.
Disclaimer
The information and publications are not meant to be, and do not constitute, financial, investment, trading, or other types of advice or recommendations supplied or endorsed by TradingView. Read more in the Terms of Use.