Technical Outlook
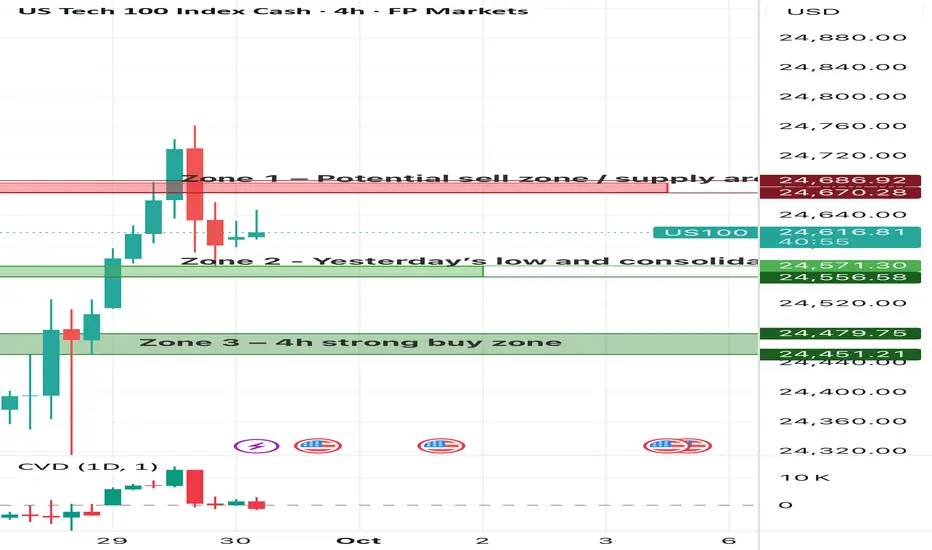
Zone 1 - Potential sell zone / supply area
Price is now trading below this level, which means the zone has shifted into a potential supply area. If the market retests this zone, sellers may step back in to defend it. Only a clean breakout and sustained hold above would flip the bias bullish and open the way for higher targets.
Zone 2 - Yesterday’s low and consolidation
This zone is an immediate support area. Price has reacted here before, and buyers will likely defend it again in the short term. A decisive break below would shift sentiment towards a deeper pullback and open the door for a test of Zone 3.
Zone 3 - Strong buy zone
This is the most significant demand area on the chart. It has shown strong buyer absorption in previous sessions and could provide a solid base for a rebound. If price revisits this level, aggressive buyers may step in, but a clean breakdown here would flip the overall bias to bearish.
Overall, sentiment around the Nasdaq-100 is positive but cautiously optimistic. Technical indicators continue to point toward further upside, with moving averages aligned in a bullish structure and strong momentum in the tech sector driven by AI and growth expectations. At the same time, fundamentals remain supportive, as investors anticipate potential rate cuts and a stable inflation backdrop in the U.S.
However, risks are still present. A significant share of retail traders are positioned short, suggesting that not all market participants are convinced of the rally’s sustainability. This creates a tension between institutional optimism and retail caution, which could lead to heightened volatility.
In short, the Nasdaq-100 currently trades with bullish momentum and constructive fundamentals, but the market remains sensitive to macroeconomic data and external shocks that could quickly shift sentiment.
Disclaimer
The information and publications are not meant to be, and do not constitute, financial, investment, trading, or other types of advice or recommendations supplied or endorsed by TradingView. Read more in the Terms of Use.
Disclaimer
The information and publications are not meant to be, and do not constitute, financial, investment, trading, or other types of advice or recommendations supplied or endorsed by TradingView. Read more in the Terms of Use.