UST 10Y Technical Outlook for the week Sept 1-5 (updated daily)
Overnight
US Core PCE and Economic Indicators Summary
On August 29, 2025, the U.S. Commerce Department reported that the Personal Consumption Expenditures (PCE) Price Index rose 0.2% in July, down from 0.3% in June, matching market expectations. The annual PCE inflation rate remained at 2.6%. Core PCE, excluding food and energy, increased 0.3% monthly and 2.9% annually, up from 2.8% in June. The Federal Reserve, targeting 2% inflation, closely tracks these metrics. Market response was subdued, with the 10-year U.S. Treasury yield rising to 4.23% (up 2.3 basis points) and the dollar index increasing 0.21% to 98.09. Analysts suggest the data supports a 0.25% Federal Reserve rate cut in September, with potential additional cuts in October and December, contingent on stable PPI and CPI reports.
Source: Reuters via TradingView News
Economic Release myfxbook.com/forex-economic-calendar
For the week of September 1–5, 2025, key economic releases likely to impact U.S. Treasury yields include Tuesday’s ISM Manufacturing PMI and employment data, which could signal economic strength or weakness. Thursday’s Initial Jobless Claims and Trade Balance may reflect tariff effects and labor trends. Friday’s Nonfarm Payrolls and Unemployment Rate are critical for Federal Reserve rate decisions, with strong data potentially lifting yields (10-year at 4.26–4.39%) and weak data possibly lowering them. Markets are closed Monday for Labor Day, heightening focus on these releases amid tariff and inflation concerns.
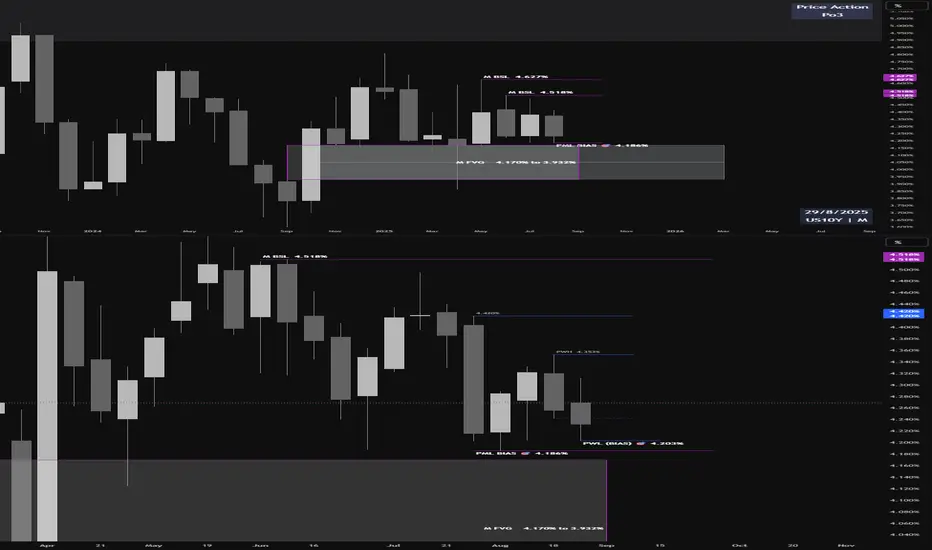
September Outlook
Monthly Analysis
The monthly chart indicates that yields have been consolidating within a narrow range of 4.18% to 4.50%. This consolidation is primarily driven by factors such as tariffs and their implications for inflation, alongside expectations for monetary policy adjustments. A bias toward the lower end of this range aligns with market anticipation of an interest rate cut at the upcoming policy meeting.
Weekly Outlook
On the weekly chart, yields are expected to continue trending downward, potentially retesting the previous low of 4.18% to 4.20%. However, investors should exercise caution toward the end of the week, as the release of payroll data may introduce volatility and influence market dynamics.

**Disclaimer:** The technical analyses provided herein are based solely on my personal analysis and are intended for my own study and reference. They do not constitute a recommendation or solicitation to buy or sell any financial instruments. Any decision made by individuals based on this analysis is their own responsibility, and I assume no liability for any losses or damages incurred as a result of using this information. It is advisable to conduct thorough research and consult with a qualified financial advisor before making any investment decisions.
Overnight
US Core PCE and Economic Indicators Summary
On August 29, 2025, the U.S. Commerce Department reported that the Personal Consumption Expenditures (PCE) Price Index rose 0.2% in July, down from 0.3% in June, matching market expectations. The annual PCE inflation rate remained at 2.6%. Core PCE, excluding food and energy, increased 0.3% monthly and 2.9% annually, up from 2.8% in June. The Federal Reserve, targeting 2% inflation, closely tracks these metrics. Market response was subdued, with the 10-year U.S. Treasury yield rising to 4.23% (up 2.3 basis points) and the dollar index increasing 0.21% to 98.09. Analysts suggest the data supports a 0.25% Federal Reserve rate cut in September, with potential additional cuts in October and December, contingent on stable PPI and CPI reports.
Source: Reuters via TradingView News
Economic Release myfxbook.com/forex-economic-calendar
For the week of September 1–5, 2025, key economic releases likely to impact U.S. Treasury yields include Tuesday’s ISM Manufacturing PMI and employment data, which could signal economic strength or weakness. Thursday’s Initial Jobless Claims and Trade Balance may reflect tariff effects and labor trends. Friday’s Nonfarm Payrolls and Unemployment Rate are critical for Federal Reserve rate decisions, with strong data potentially lifting yields (10-year at 4.26–4.39%) and weak data possibly lowering them. Markets are closed Monday for Labor Day, heightening focus on these releases amid tariff and inflation concerns.
September Outlook
Monthly Analysis
The monthly chart indicates that yields have been consolidating within a narrow range of 4.18% to 4.50%. This consolidation is primarily driven by factors such as tariffs and their implications for inflation, alongside expectations for monetary policy adjustments. A bias toward the lower end of this range aligns with market anticipation of an interest rate cut at the upcoming policy meeting.
Weekly Outlook
On the weekly chart, yields are expected to continue trending downward, potentially retesting the previous low of 4.18% to 4.20%. However, investors should exercise caution toward the end of the week, as the release of payroll data may introduce volatility and influence market dynamics.
**Disclaimer:** The technical analyses provided herein are based solely on my personal analysis and are intended for my own study and reference. They do not constitute a recommendation or solicitation to buy or sell any financial instruments. Any decision made by individuals based on this analysis is their own responsibility, and I assume no liability for any losses or damages incurred as a result of using this information. It is advisable to conduct thorough research and consult with a qualified financial advisor before making any investment decisions.
Disclaimer
The information and publications are not meant to be, and do not constitute, financial, investment, trading, or other types of advice or recommendations supplied or endorsed by TradingView. Read more in the Terms of Use.
Disclaimer
The information and publications are not meant to be, and do not constitute, financial, investment, trading, or other types of advice or recommendations supplied or endorsed by TradingView. Read more in the Terms of Use.