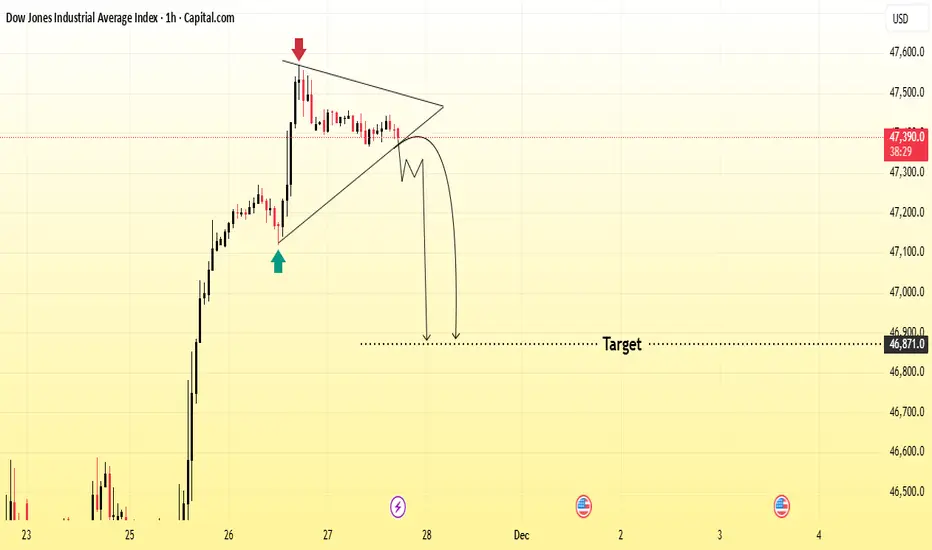
Price is forming a symmetrical triangle after a strong bullish move. The chart shows rejection from the top (red arrow) and a possible breakdown from the triangle pattern.
If price breaks below the lower trendline, it may drop toward the marked target zone around 46,800–46,600.
Bias: Bearish below triangle
Confirmation: Clean breakout + retest
Target: 46,800 area
If price breaks below the lower trendline, it may drop toward the marked target zone around 46,800–46,600.
Bias: Bearish below triangle
Confirmation: Clean breakout + retest
Target: 46,800 area
Join My Telegram Channel
t.me/EliteGoldAnalysis34
Join My Vip Memebership
t.me/+hRsF7h9mMBE2NWJk
t.me/EliteGoldAnalysis34
Join My Vip Memebership
t.me/+hRsF7h9mMBE2NWJk
Disclaimer
The information and publications are not meant to be, and do not constitute, financial, investment, trading, or other types of advice or recommendations supplied or endorsed by TradingView. Read more in the Terms of Use.