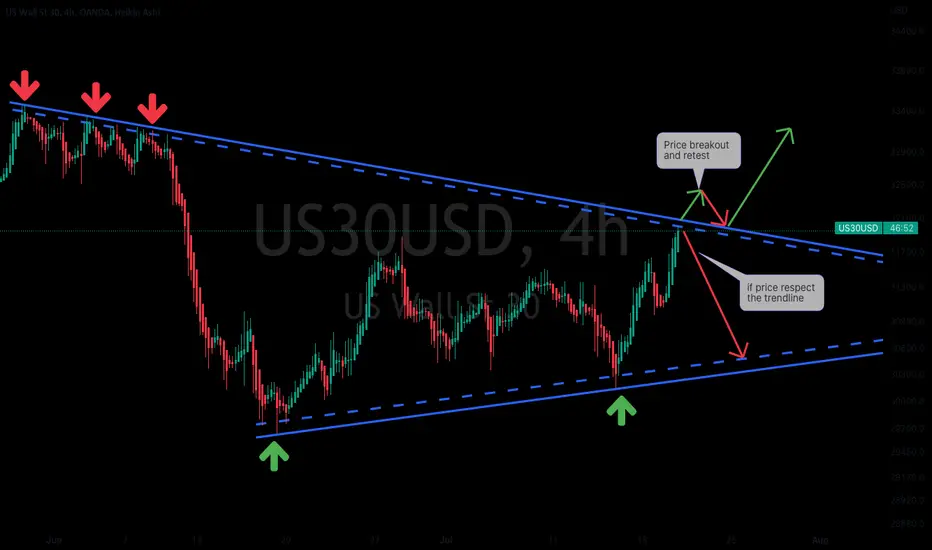
My daily analysis on US 30 on H4 chart. The price is at the resistance trendline. Two things that may take place at this level. 1) the price can reject and move down or 2) we will see a breakout.
Disclaimer
The information and publications are not meant to be, and do not constitute, financial, investment, trading, or other types of advice or recommendations supplied or endorsed by TradingView. Read more in the Terms of Use.
Disclaimer
The information and publications are not meant to be, and do not constitute, financial, investment, trading, or other types of advice or recommendations supplied or endorsed by TradingView. Read more in the Terms of Use.