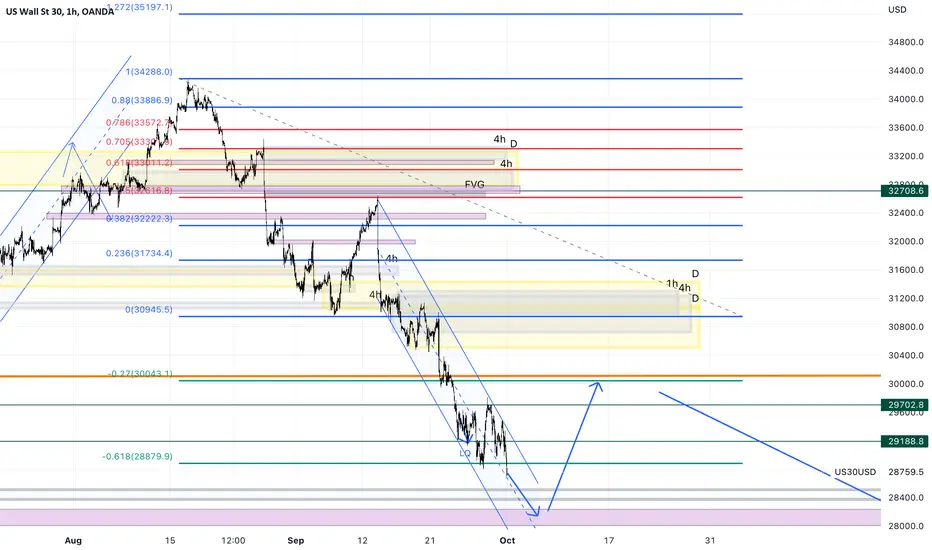
Last week I thought that US30 will retrace, this was not the case and went down.
My long term bias is very very bearish on US30, but short-term bias is not so bearish. I still think, we will see a retracement. New month is starting and normally at the beginning of the month the assets retrace a bit.
Comparison

From this chart we can see, there is no SMT divergence. NASDAQ also made new lower low.
BUT
The COT reports shows that the big players are continuing to take profit and closed more short positions.
Momentum

Momentum is very bearish, but it seems that price is oversold:
-price move with the lower band since 7 days
-middle and short term trend have slope of -70 grad (angle) - around -70 normally are the troughs
- Oscillator is also oversold near the boundary level
-RSI is near the 20, normally from this level price retrace
-RSI is starting to go up
-it seems that composite index is going up, making series of divergences
-price already reached cluster of monthly pivot points
GDP

Last three months US30 is dropping, but GDP was reported the same as last time. Although that GDP is the same, last week US30 fell again.
Normally GDP and Stock market move in same direction and if there is a divergence, most likely price is manipulated, because of the profit taking.
PMI

PMI indicator also slowed down. Thats why we can see retracement or slow down.
Summery:
I am very very bearish, but right now I feel not comfortable to short the asset, because of GDP, COT reports and other indicators.
My long term bias is very very bearish on US30, but short-term bias is not so bearish. I still think, we will see a retracement. New month is starting and normally at the beginning of the month the assets retrace a bit.
Comparison
From this chart we can see, there is no SMT divergence. NASDAQ also made new lower low.
BUT
The COT reports shows that the big players are continuing to take profit and closed more short positions.
Momentum
Momentum is very bearish, but it seems that price is oversold:
-price move with the lower band since 7 days
-middle and short term trend have slope of -70 grad (angle) - around -70 normally are the troughs
- Oscillator is also oversold near the boundary level
-RSI is near the 20, normally from this level price retrace
-RSI is starting to go up
-it seems that composite index is going up, making series of divergences
-price already reached cluster of monthly pivot points
GDP
Last three months US30 is dropping, but GDP was reported the same as last time. Although that GDP is the same, last week US30 fell again.
Normally GDP and Stock market move in same direction and if there is a divergence, most likely price is manipulated, because of the profit taking.
PMI
PMI indicator also slowed down. Thats why we can see retracement or slow down.
Summery:
I am very very bearish, but right now I feel not comfortable to short the asset, because of GDP, COT reports and other indicators.
Disclaimer
The information and publications are not meant to be, and do not constitute, financial, investment, trading, or other types of advice or recommendations supplied or endorsed by TradingView. Read more in the Terms of Use.
Disclaimer
The information and publications are not meant to be, and do not constitute, financial, investment, trading, or other types of advice or recommendations supplied or endorsed by TradingView. Read more in the Terms of Use.